Table of Contents
Learning Curve Algorithm
- Knowledge component attribution
- Step time and opportunity attribution
- Learning curve plotting
- Creating aggregate curves
- Edge cases in determining KC or step-time attribution
To draw a learning curve, DataShop calculates individual points based on step aggregate values, which can be seen in the student-step rollup table. As the table name implies, these aggregate values are calculated by single student per single step. Two key values in these aggregates are the knowledge components (KCs) attributed to the student-step attempts, and the time attributed to the student step, or step time.
Knowledge component attribution
Most attempts in the transaction data have a knowledge component (KC) associated with them. In Table 1 (below), three attempts are shown.
| Tx # | Time | Step | Evaluation | KC |
|---|---|---|---|---|
| 1 | 11:51 | Step X | Hint | KC B |
| 2 | 11:52 | Step X | Incorrect | KC B |
| 3 | 11:53 | Step X | Correct | KC A |
In this example, the first two transactions are error attempts on step X. The tutor attributed them to KC B. The third transaction is a correct attempt on step X, which the tutor attributed to KC A.
Datashop categorizes this KC error attribution information as the tutor's best guess as to which KC(s) the student was working toward. For the student-step described in Table 1, DataShop attributes KC A to the step; KC B is not attributed to the step. Since the correct attempt existed for the step, DataShop attributed only the KC from the correct attempt, and assumed that the preceding attempts were really toward KC A.
KC attribution rule 1: If a correct attempt exists for a student-step, attribute all KCs on that correct attempt to the student-step.
A correct attempt may not exist for a student-step. In Table 2, no correct attempt exists for that student-step.
| Tx # | Time | Step | Evaluation | KC |
|---|---|---|---|---|
| 4 | 11:55 | Step Y | Incorrect | KC A |
| 5 | 11:56 | Step Y | Hint | KC B |
| 6 | 11:57 | Step Y | Incorrect | KC A |
If no correct attempt exists for the student-step, DataShop assigns the KCs from all error attempts to that step. For step Y, the KCs assigned are A and B.
KC attribution rule 2: If no correct attempt exists for a student-step, attribute the union of all KCs from all error attempts on that step to the student-step.
Step time and opportunity attribution
DataShop also needs to attribute a time to each step so that it can identify and sort opportunities.
For a given student-step in which a correct attempt exists, DataShop attributes the time of the first correct transaction as the step time. For a student-step in which no correct attempt exists, DataShop assigns the maximum time for all error attempts as the step time. The student-steps are then ordered by the step time to determine the opportunities for the KCs.
In the example in Table 1 below, a correct attempt exists.
| Tx # | Time | Step | Evaluation | KC |
|---|---|---|---|---|
| 1 | 11:51 | Step X | Hint | KC B |
| 2 | 11:52 | Step X | Incorrect | KC B |
| 3 | 11:53 | Step X | Correct | KC A |
For step X, the step time is therefore "11:53", the time of the first correct attempt.
In Table 2, no correct attempt exists.
| Tx # | Time | Step | Evaluation | KC |
|---|---|---|---|---|
| 4 | 11:55 | Step Y | Incorrect | KC A |
| 5 | 11:56 | Step Y | Hint | KC B |
| 6 | 11:57 | Step Y | Incorrect | KC A |
For step Y, the step time is therefore "11:57", the maximum time of the incorrect attempts.
The resulting opportunity counts for KCs A and B across steps X and Y would be:
| Step | KC | Opportunity |
|---|---|---|
| Step X | KC A | 1 |
| Step Y | KC A, KC B | 2, 1 |
KC A on step X receives opportunity 1 because its step time (11:53) comes before the step time for KC A on step Y (11:57). KC B receives opportunity 1 because it only appears once, with step Y at 11:57. Step Y has KCs A and B associated with it due to KC attribution rule 2 (see above). The opportunity counts are also incremented independently for the two KCs on step Y.
Learning curve plotting
With the KC and step-time attribution determined, DataShop can then plot points in a learning curve.
We can draw a simple error rate learning curve for KC A based on the six transactions in Tables 1 and 2.
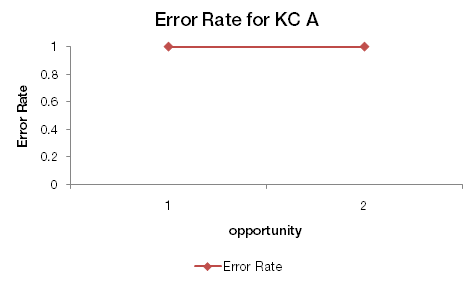
This graph can be summarized as: On the first opportunity to demonstrate KC A (step X), the first attempt was a hint request (ie, an error). On the second opportunity (step Y), the first attempt was an incorrect attempt (ie, an error). As error rate is either 0 or 1 for a step, we have two error rates of 1 (100%).
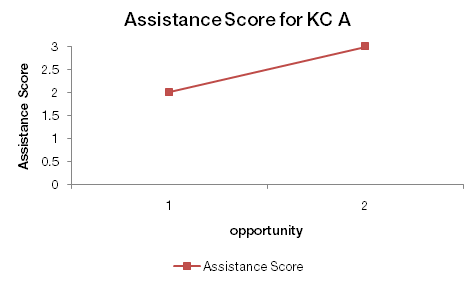
An assistance score (incorrect attempts plus hint requests) graph would look like the following:
Creating aggregate curves
With data for individual student-steps stored, DataShop can create aggregate graphs (KC A across all students, for example) by simply computing an average for each opportunity. Viewing by student or KC means computing an average for a subset of all data points at each opportunity.
Edge cases in determining KC or step-time attribution
In some data, a single step may repeat for a given student. DataShop determines the boundary between opportunities by examining problem start events. A problem start event between two student actions toward the same step means that the second action is toward a new, unique opportunity.
A problem start event can be indicated in an XML log or tab-delimited file that describes the tutoring session. In XML, a problem start event is indicated by a context message with a name attribute of "START_PROBLEM". In a tab-delimited file, a problem start event is indicated by an increment of the "Problem View" column or a new value in the "Problem Start Time" column.