Learning Curve Examples
- Assistance Score example
- Error Rate example
- Step Duration example
- Correct Step Duration example
- Error Step Duration example
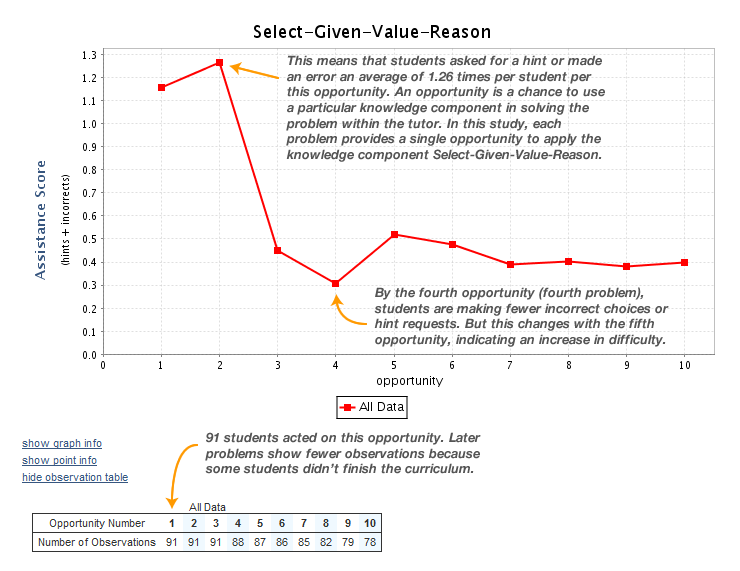
Assistance Score example
An assistance score learning curve is shown below for the knowledge component "Select-Given-Value-Reason". In this graph, the point at opportunity 2 signifies that students asked for a hint or made an incorrect attempt an average of 1.26 times for this opportunity.
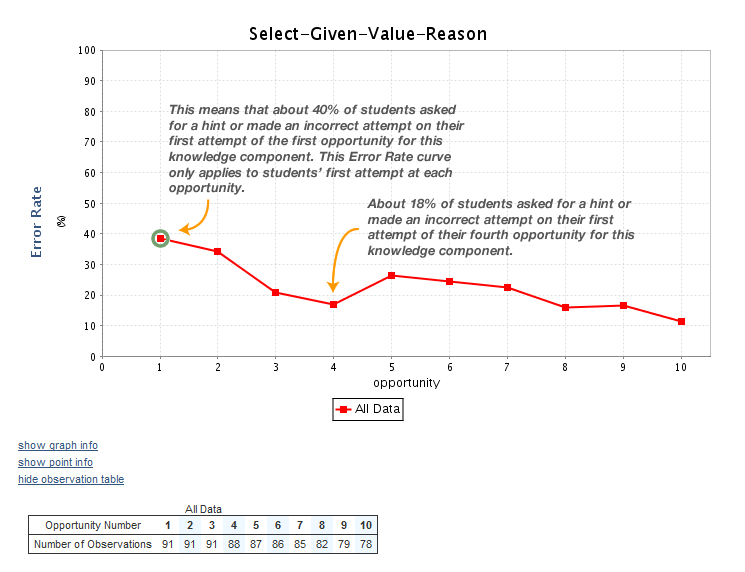
Error Rate example
An error rate learning curve is shown below for the same knowledge component. The first point on the graph shows that 40% of students that attempted this opportunity made an error or asked for a hint on their first attempt.
Error rate differs from assistance score in that it provides data based only on first attempt. As such, an error rate provides no distinction between a student that made multiple incorrect attempts and a student that made only one.
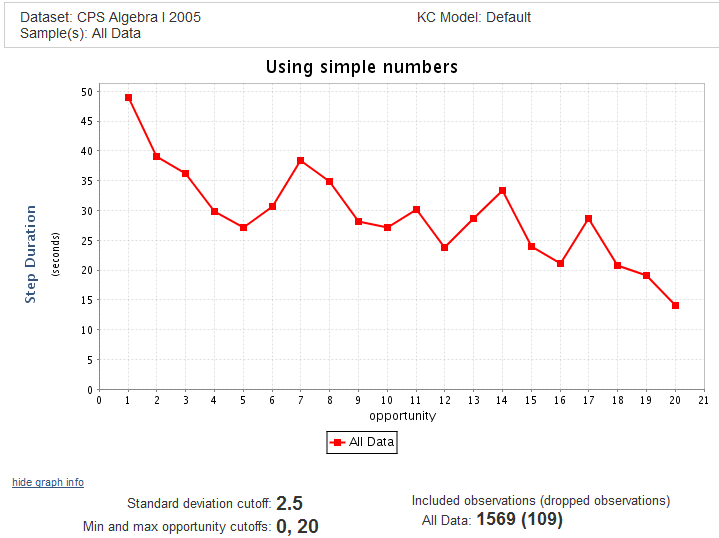
Step Duration example
A “Step Duration” learning curve for KC “Using simple numbers” is shown below. A maximum opportunity cutoff of 20 and a standard deviation cutoff of 2.5 are set.
In this curve, we can see that step duration varies over opportunities, but has a downward trend. On later opportunities, students spent less time on the step before completing it correctly.
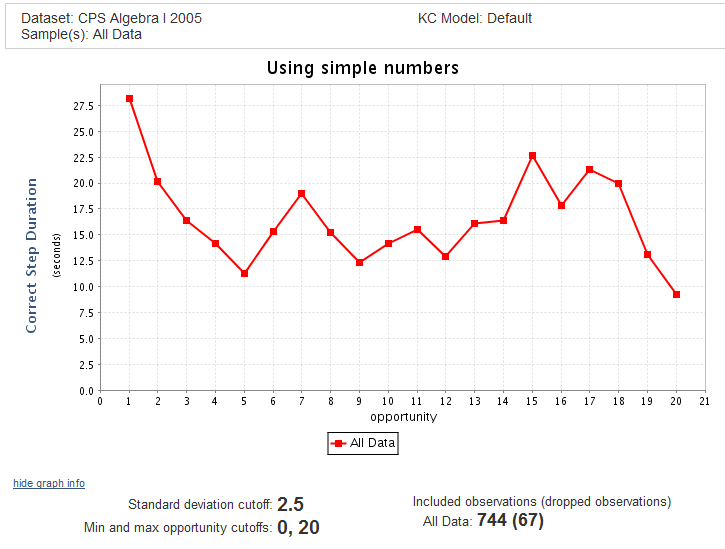
Correct Step Duration example
A “Step Duration” learning curve for KC “Using simple numbers” is shown below. A maximum opportunity cutoff of 20 and a standard deviation cutoff of 2.5 are set.
In this curve, we can see that for students whose first attempts were correct, their average time to reach that correct response appears to decrease over the first 5 opportunities, but then increases as they encounter more steps where they must demonstrate “Using simple numbers”. This might indicate that the knowledge component is too general, and that at least one other hidden knowledge component might be involved in these data points.
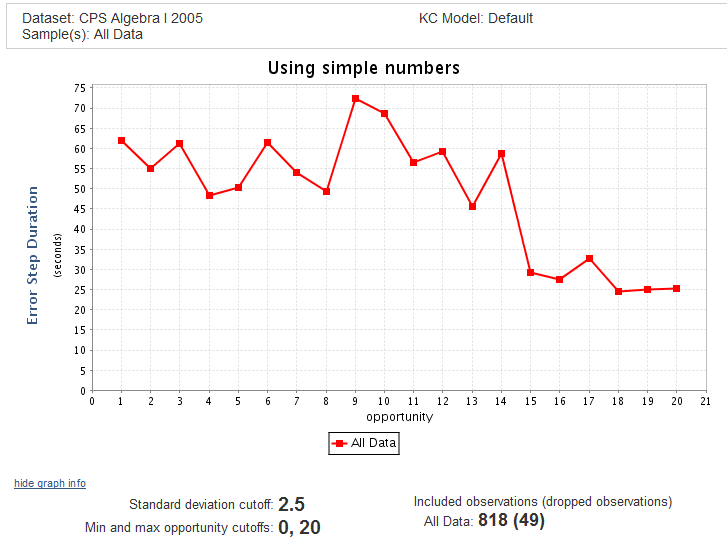
Error Step Duration example
An “Error Step Time” learning curve for KC “Using simple numbers” is shown below. A maximum opportunity cutoff of 20 and a standard deviation cutoff of 2.5 are set.
In this curve, we can see that for students whose first attempts were errors, their average time through the end of the step varies between 48 and 72 seconds through the first 10 opportunities. Looking beyond these 10 opportunities, however, the number of data points drops dramatically—the observation table (not shown) lists 164 observations for the first few opportunities, but fewer than 10 for the latter 10 opportunities—so we probably can't suspect there is any downward trend.