Glossary
To promote and exemplify PSLC's theoretical framework, the DataShop web application uses terms defined by researchers in the PSLC theoretical hierarchy. These terms are defined in the PSLC theory wiki glossary, but are re-defined here in terms of the DataShop web application. In addition, DataShop introduces new terms that expand upon existing terminology. Researchers are encouraged to explore both the theory wiki glossary and the current page to enhance their use of DataShop.
- Problem
- Step
- Transaction
- Knowledge Component
- Opportunity
- Learning Curve
- Error Rate
- Assistance Score
- Observation
- Problem View
- Knowledge Component Model
- Opportunity Cutoff
- Standard deviation cutoff
- Transaction Duration
- Step Duration
- Correct Step Duration
- Error Step Duration
- Problem Hierarchy
- Problem Event
- AFM
- Performance Profiler
- Error Report
- Event Type
Key Terms
Five key terms used in DataShop form the building blocks for other more complex terms. These are problem, step, transaction, knowledge component, and opportunity. To more concretely define these terms, we'll use the following scenario:
Using a computer tutor for geometry, a student completes a problem where she is asked to find the area of a piece of scrap metal left over after removing a circular area (the end of a can) from a metal square (Figure-1). The student enters everything in the worksheet except for the row labels, and column and 'Unit' labels for the first three columns.
The tutor records the student's actions and stores them in a log file, which is imported and analyzed by DataShop. DataShop creates two tables: a transaction table and a step table. Table-1 and Table-2 illustrate portions of these tables.
Click image for larger version
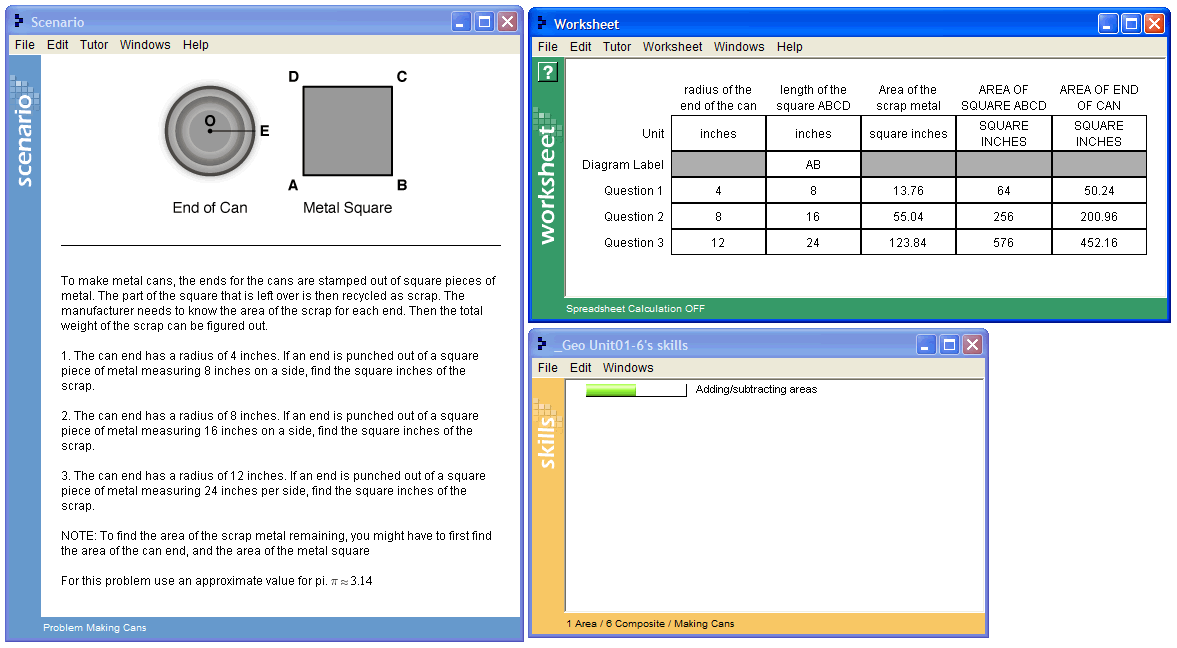
Figure-1: An example problem from Carnegie Learning's Cognitive Tutor 2005: Making Cans
- Table-1: Transaction table excerpt
- Table-2: Step table excerpt
- Video: Solving "Making Cans", Question 1 (1m:27s)
- Problem
A problem is a task for a student to perform that typically involves multiple steps. In the example above, the problem asks the student to find the area of a piece of scrap metal left over after removing a circular area (the end of a can) from a metal square (Figure-1).
In language domains, such tasks are more often called activities or exercises rather than problems. A language activity, for example, could involve finding and correcting all of the grammatical errors in a paragraph.
- Step
A step is an observable part of the solution to a problem. Because steps are observable, they are partly determined by the user interface available to the student for solving the problem.
In the example problem above, the correct steps for the first question are:
- find the radius of the end of the can (a circle)
- find the length of the square ABCD
- find the area of the end of the can
- find the area of the square ABCD
- find the area of the left-over scrap
This whole collection of steps comprises the solution. The last step can be considered the 'answer', and the others as 'intermediate' steps.
It is not required, however, that a student complete a problem by performing only the correct steps—the student might request a hint from the tutor, or enter an incorrect value. How do we characterize the actions of a student that is working towards performing a step correctly? These actions are referred to as transactions and attempts.
- Transaction
-
A transaction is an interaction between the student and the tutoring system.
Students may make incorrect entries or ask for hints before getting a step correct. Each hint request, incorrect attempt, or correct attempt is a transaction; and a step can involve one or more transactions.
In Table-1 above, a list of transactions is displayed for a single student working on two tutor problems. Transaction 9 of Table-1 shows that the student correctly entered a '4' in the tutor interface—specifically, in the first column of the row labeled 'Question 1' (see Figure-1). Transaction 10 shows the correct entry of the '8' in the next column. In both cases, there is one transaction for each step. In transactions 11 and 12, we see incorrect entries ('32','4') for the 'Area of the scrap metal'. The student returns to this step in transaction 15 and correctly enters 13.76, but first finds the areas of the square and circle (transactions 13 and 14). The step (SCRAP-METAL-AREA Q1) therefore involved three transactions. These multiple transactions are also known as attempts for the given step.
In Table-2, transactions have been consolidated and displayed by student and step, producing a student-step stable. In line 6 of Table-2, we see '0' in Total Incorrects for the step corresponding with transaction 9. In line 10, we see the two incorrects on step (SCRAP-METAL-AREA Q1) corresponding with transactions 11 and 12. Line 3 shows the two incorrects and one hint corresponding with transactions 3–5.
A transaction can be either “tutored” or “untutored”. A tutored transaction is one in which the tutoring system identifies the student action as toward a step. Examine the “Tutor Response Type” column of a transaction export to determine this: tutored transactions have a value in this column, while untutored transactions do not. (Other step-related columns such as Tutor Response Subtype, Step Name, Attempt At Step, and Outcome should also be blank for an untutored transaction.)
- Knowledge Component
-
A knowledge component is a piece of information that can be used to accomplish tasks, perhaps along with other knowledge components. Knowledge component is a generalization of everyday terms like concept, principle, fact, or skill, and cognitive science terms like schema, production rule, misconception, or facet.
Each step in a problem require the student to know something, a relevant concept or skill, to perform that step correctly. In DataShop, each step can be labeled with a hypothesized knowledge component needed—see the last column of Table-2 to see example KC labels. In line 9 of Table-2, the researcher has hypothesized that the student needs to know CIRCLE-AREA to find POG-AREA. In line 10, the COMPOSE-AREAS knowledge component is hypothesized to be be needed to find the SCRAP-METAL-AREA.
In Table-2 above, the knowledge components are shown in the last column. Every knowledge component is associated with one or more steps.
In DataShop, one or more knowledge components can be associated with a step. This association is typically originally defined by the problem author, but researchers can provide alternative knowledge components and associations with steps, also known as a Knowledge Component Model.
- Opportunity
An opportunity is a chance for a student to demonstrate whether he or she has learned a given knowledge component. An opportunity exists each time a step is present with the associated knowledge component.
In column Opportunity Count of Table-2, the opportunity count increases by one each time the student encounters a step with the associated knowledge component.
An opportunity is both a test of whether a student knows a knowledge component and a chance for the student to learn it. While students may make multiple attempts at a step or request hints from a tutor (these are transactions), the whole set of attempts are considered a single opportunity. As a student works through steps in problems (and multiple problems), they will have multiple opportunities to apply a knowledge component.
When the Event Type column is present in transaction data, the opportunity count is computed differently. A student's opportunity count is only incremented when Event Type column in transaction data is "assess_instruct", "instruct" or blank.
- Learning Curve
A learning curve is a line graph displaying opportunities across the x-axis, and a measure of student performance along the y-axis. As a learning curve visualizes student performance over time, it should reveal improvement in student performance as opportunity count (ie, practice with a given knowledge component) increases.
Measures of student performance available in learning curves are Error Rate, Assistance Score, number of incorrects or hints, Step Duration, Correct Step Duration, and Error Step Duration.
- Error Rate
The percentage of students that asked for a hint or were incorrect on their first attempt. For example, an error rate of 45% means that 45% of students asked for a hint or performed an incorrect action on their first attempt.
For each student on each step, the error rate is computed as follows:
- If Incorrects = 0 or Hints = 0, the Error Rate = 0;
- If Incorrects > 0 or Hints > 0, the Error Rate = 1.
See Table-2 for examples.
Both incorrect actions (errors of commission) and hint requests (errors of omission—the student did not know how to perform the step on his or her own) are considered errors.
- Assistance Score
-
For a given opportunity, the number of incorrect attempts plus hint requests equals the assistance score.
In the example above of a single student working on a problem, assistance score is derived by simply adding the number of wrong attempts and the hints requested for each step.
- Observation
-
An observation is a group of transactions for a particular student working on a particular step within a problem view. If within these constraints there is only one transaction recorded, an observation will still exist for that single transaction.
Put another way, an observation is available each time a student takes an opportunity to demonstrate a knowledge component.
In the sample data shown in Table-2, there are four observations for knowledge component circle-area and four for compose-areas.
On a larger sample of 10 students, if all ten students use a tutor that presents two opportunities to demonstrate Knowledge Component A, there would be ten observations per opportunity, and 20 total observations.
- Problem View
The number of times the student encountered the problem so far. This counter increases with each instance of the same problem. This number is based on the notion of a distinct problem: DataShop identifies similar problems as distinct when the problem name is different or when two problems with the same name don't have identical versions of the following logged values:
- problem name
- context
- tutor_flag (whether or not the problem or activity is tutored) and "other" field
For more on the logging of these fields, see the description of the "problem" element in the Guide to the Tutor Message Format.
See also the definition of problem view in the context of a student-step table.
- Knowledge Component Model
A list of mappings between each step and one or more knowledge components; also known as a Transfer Model or a Skill Model.
In Figure-2 below, two learning curves with different knowledge component models are shown.
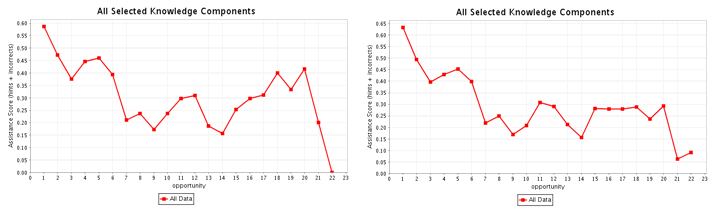
Figure-2: Two learning curves, each with a different knowledge component model applied.
- Opportunity Cutoff
A minimum and/or maximum number of opportunities a student must have had with a knowledge component for the student-knowledge component pair to be included in the data. This filtering mechanism is available on the learning curve report.
- Standard Deviation Cutoff
The number of standard deviations above and below the mean for which to include data points. Data points (observations) falling outside the specified number of standard deviations are dropped from the graph
- Transaction Duration
Duration of the transaction in seconds. This is the time of the current transaction minus that of the preceding transaction or problem start event—whichever is closer in time to the current transaction. If this difference is greater than 10 minutes, DataShop reports the duration as null (a dot). If the current transaction is preceded by neither another transaction or a problem start event, duration is shown as null. The duration is formatted without decimal places if the two times used in the calculation were without millisecond precision.
- Step Duration
Previously called "Assistance Time", Step Duration is the total length of time spent on a step. It is calculated by adding all of the durations for transactions that were attributed to a given step. Step Duration differs from previous latency calculations in DataShop in that it's derived by summing transaction durations, not finding the difference between two points in time (step start time and the last correct attempt), which can attribute elapsed time to multiple steps if they occurred in an interleaving order.
- Correct Step Duration
-
The step duration if the first attempt for the step was correct. Correct Step Duration might also be described as "reaction time" since it's the duration of time from the previous transaction or problem start event to the first correct attempt. This measure was previously labeled "Correct Step Time (sec)". Note that Correct Step Duration is equal to Step Duration when the first attempt by the student is correct.
- Error Step Duration
The step duration if the first attempt for the step was an error (an incorrect attempt or hint request).
- Problem Hierarchy
The hierarchy of curriculum levels containing the problem. For example, a problem might be contained in a Unit A, Section B hierarchy.
- Problem Event
A class of events that describe changes at the problem level (eg, problem started, skipped, resumed, etc). Currently DataShop only uses "START_PROBLEM" problem events, which are used to determine problem start time and other time-related values. An example of this usage is shown on the Student-Step Rollup page.
- AFM
Acronym for Additive Factor Model, a logistic regression method which uses a set of customized Item-Response models to predict how a student will perform for each knowledge component on each learning opportunity. AFM was developed at Carnegie Mellon by Hao Cen, Kenneth Koedinger, and Brian Junker. In DataShop, the AFM algorithm is run over each KC model of each dataset, producing data that populates predicted learning curves and other reports.
View the AFM formula.
- Performance Profiler
A multi-purpose DataShop tool for examining data by various measures and at varying levels of granularity.
- Error Report
A DataShop report that provides summaries of student performance; actual values students entered and the feedback they received; and at-a-glance information on problem coverage.
- Event Type
An optional column in DataShop transaction data. Allowed values are: assess, instruct and assess_instruct; an empty value is interpreted as "assess_instruct". The value in the Event Type column affects how the opportunity count is computed for the Student Step Rollup export. Values of "instruct" and "assess_instruct" cause the opportunity count to be incremented by 1. Value of "instruct" causes the Outcome column to be blank.
