


Data Export
Data Export Report
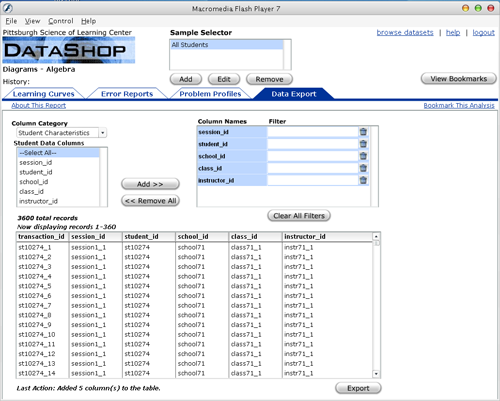
The Data Export report, as the name implies, allows the user to export data transactions into a format accepted by the user's preferred statistical program when additional analysis not supported by the Data Shop is required.
We found this report necessary because of the wide variety of tasks that the Data Shop has to support, and as such, no single report would be sufficently comprehensive enough to support all the possible tasks users might want to perform. Hence, we proposed this report to help them filter down only the data they are interested in, and then export these data to their preferred statistical package or analysis application.
Each feature is listed out below, but to summarize, we've presented a value / difficulty matrix here to summarize each feature. Details are provided under each feature below.
Column Names in Selection List Order
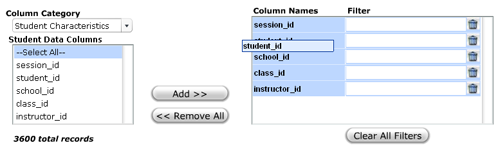
The order of the column names as it appears in the selection list controls the order they appear in the data-grid. Each column can be moved to a specific location by dragging its column name to a new position. The column in the data-grid itself is also drag-able and would fulfill the same functionality but more directly (as would be described in more details below)
Importance: Medium
Difficulty: Medium
Filter Field/Popup
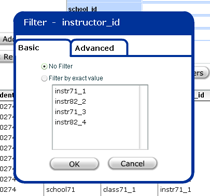
Upon clicking the filter field, a popup is brought up to display the two classes of filters, as follows:
Basic (left figure) - allows a user to filter by a specific value or values, as displayed and selected in the list in the popup. As our prototype has a very basic filtering feature due to implementation and time constraints, we would recommend that the system includes filters that change depending on the datatype of the column being filtered (i.e. date fields or continuous variables) .
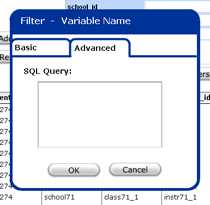
Advanced (right figure) - allows one to enter a specific query to pull out the relevant data. We included this feature as we found that some users have a need for complex combinations of queries, and no single interface would be able to support all such permutations. However, as this is a potential security as well as performance issue, we recommend that this advanced option be available only to selected users.
Importance: High (for basic), Med (for advanced)
Difficulty: Low (for basic), High (for advanced)
Trash Icon

This removes the column from the selection list. Filters for the column will remain however, until it is explicitly cleared, by either selecting "No filter" within the popup or if the "Clear All Filters" or "Remove All" buttons are pressed.
Importance: High
Difficulty: Low
ID/Name Toggle (Not implemented in the prototype)
This is a toggle that determines whether the column it controls displays either the ids of the values or the actual values they represent. This feature would help bring context to the report as the text of the field would be more meaningful than an id value.
Importance: Medium
Difficulty: Low
Drag-able Data-Grid Column Headers (Not implemented in prototype)
The column headers can be used to sort the data-grid. They can also be dragged around to change the order that the columns are displayed in. While we didn't test this feature on any one test (as it's not implemented in our prototype) we have data to show that direct manipulation is desired (U27_TA10) and as such we recommended this feature, along with other direct manipulation features.
Importance: Low
Difficulty: High