


Learning Curve
Cut-off Screen
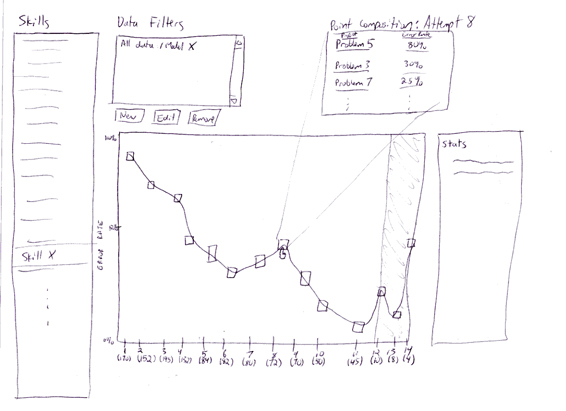
One neat aspect of this design is the idea that users could have a virtual "screen" on the right hand side to pull over and cut off outlying points. We were never able to implement this design but got some validation for the concept during the summer workshop when a user literally placed a piece of paper over her screen to cut off the outlying points.
Trellis Display
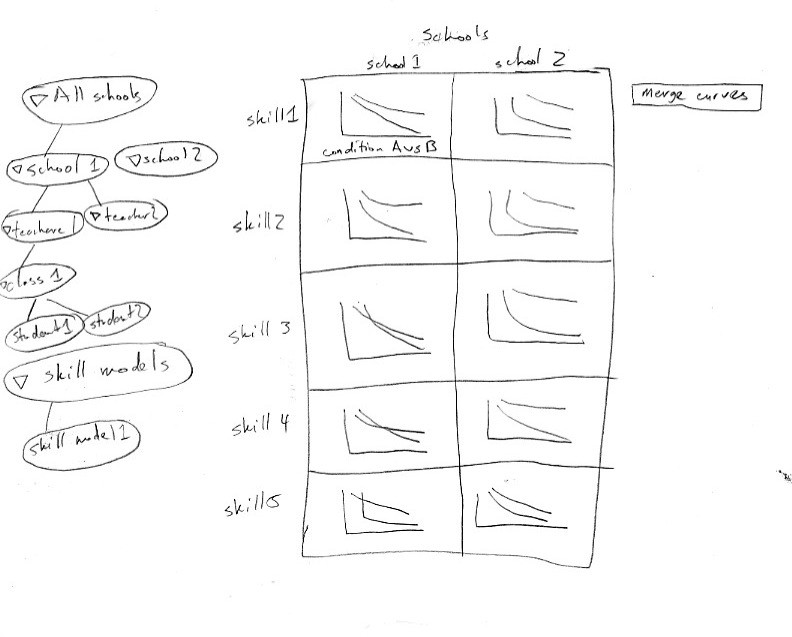
This is a trellis display. A trellis display is a display with multiple graphs laid out in two dimensions. This layout increases the user's ability to make comparisons in a limited space across multiple dimensions simultaneously. On a simple graph with two lines, you are showing difference across a single variable. For example, different lines mean different skills. A trellis display lets you visually compare across two more variables. For example, if we put the previous example on a trellis display, it could be that each row of the trellis display represents a different school and each column represents a different condition.
Learning Curve Sketch
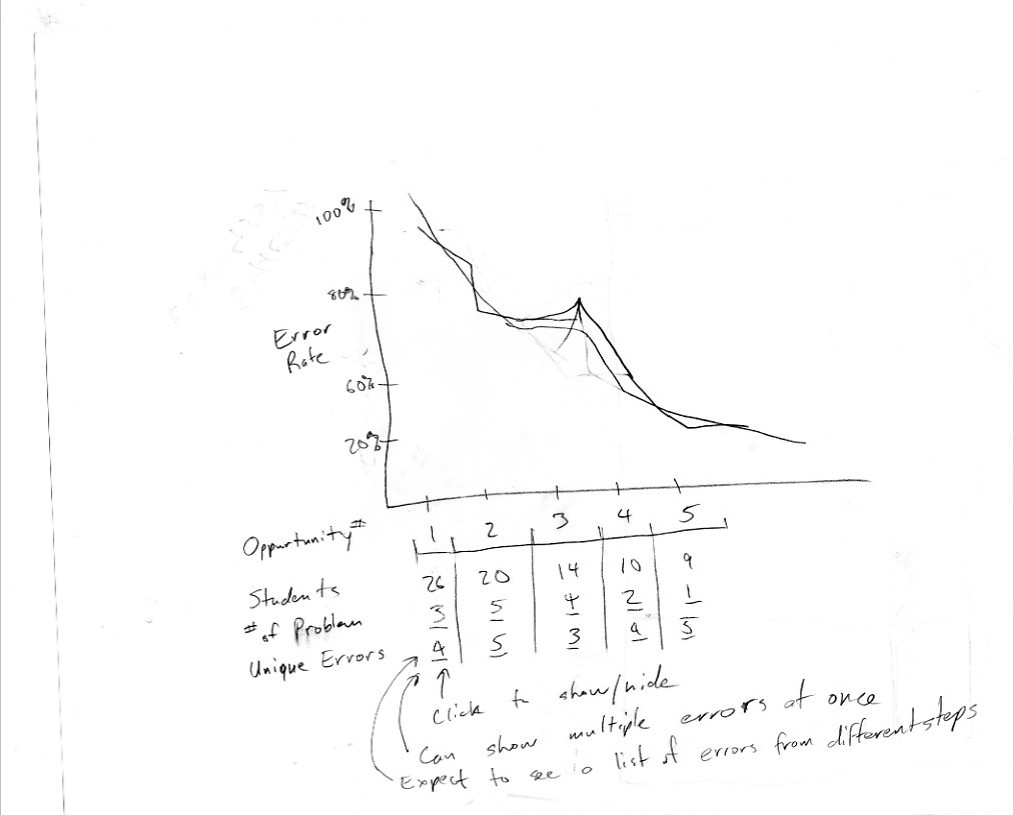
This early sketch for the learning curve display fell apart as soon as we tried to account for the users' need to compare two curves at once.