News Archive - 2018
Tuesday, October 30 2018
LearnSphere 2.1 released!
This release features improvements to Tigris, the online workflow authoring tool which is part of LearnSphere.
- Redesign of workflow list to allow for better navigation.
- Advanced search of workflows.
- New visualization components.
- Private options.
- WebServices for LearnSphere.
- Ability to link a workflow to one or more datasets.
- Unique URL for each workflow gives ability to link directly to a workflow.
- In addition to the above changes, there are several component improvements.
- The R-based iAFM and Linear Modeling components have been optimized, resulting in marked performance improvements.
- Learning Curve categorization. A new feature, enabled by default, categorizes the learning curves (graphs of error rate over time for different KCs, or skills) generated by this visualization component into one of four categories. This can help to identify areas for improvement in the KC model or student instruction. Learn more about the categories here.
- The OutputComparator now allows for multiple matching conditions.
- There is a new component -- OLI LO to KC -- that can be used to map learning objectives for an OLI course into DataShop KC models. The component builds a KC model import for a given OLI skill model.
- The output format for the PythonAFM component is now XML, making it easier to use in the OutputComparator.
- The TextConverter component has been extended so that XML, tab-delimited and comma-separated (CSV) inputs can be converted to either tab-delimited or CSV outputs.
Returning users will recognize that the layout of the main workflows page has changed to allow for better navigation, both of their own and other's workflows. Users can now create folders in which to organize their workflows, choosing to group them by analysis methods, course or data type, for example.
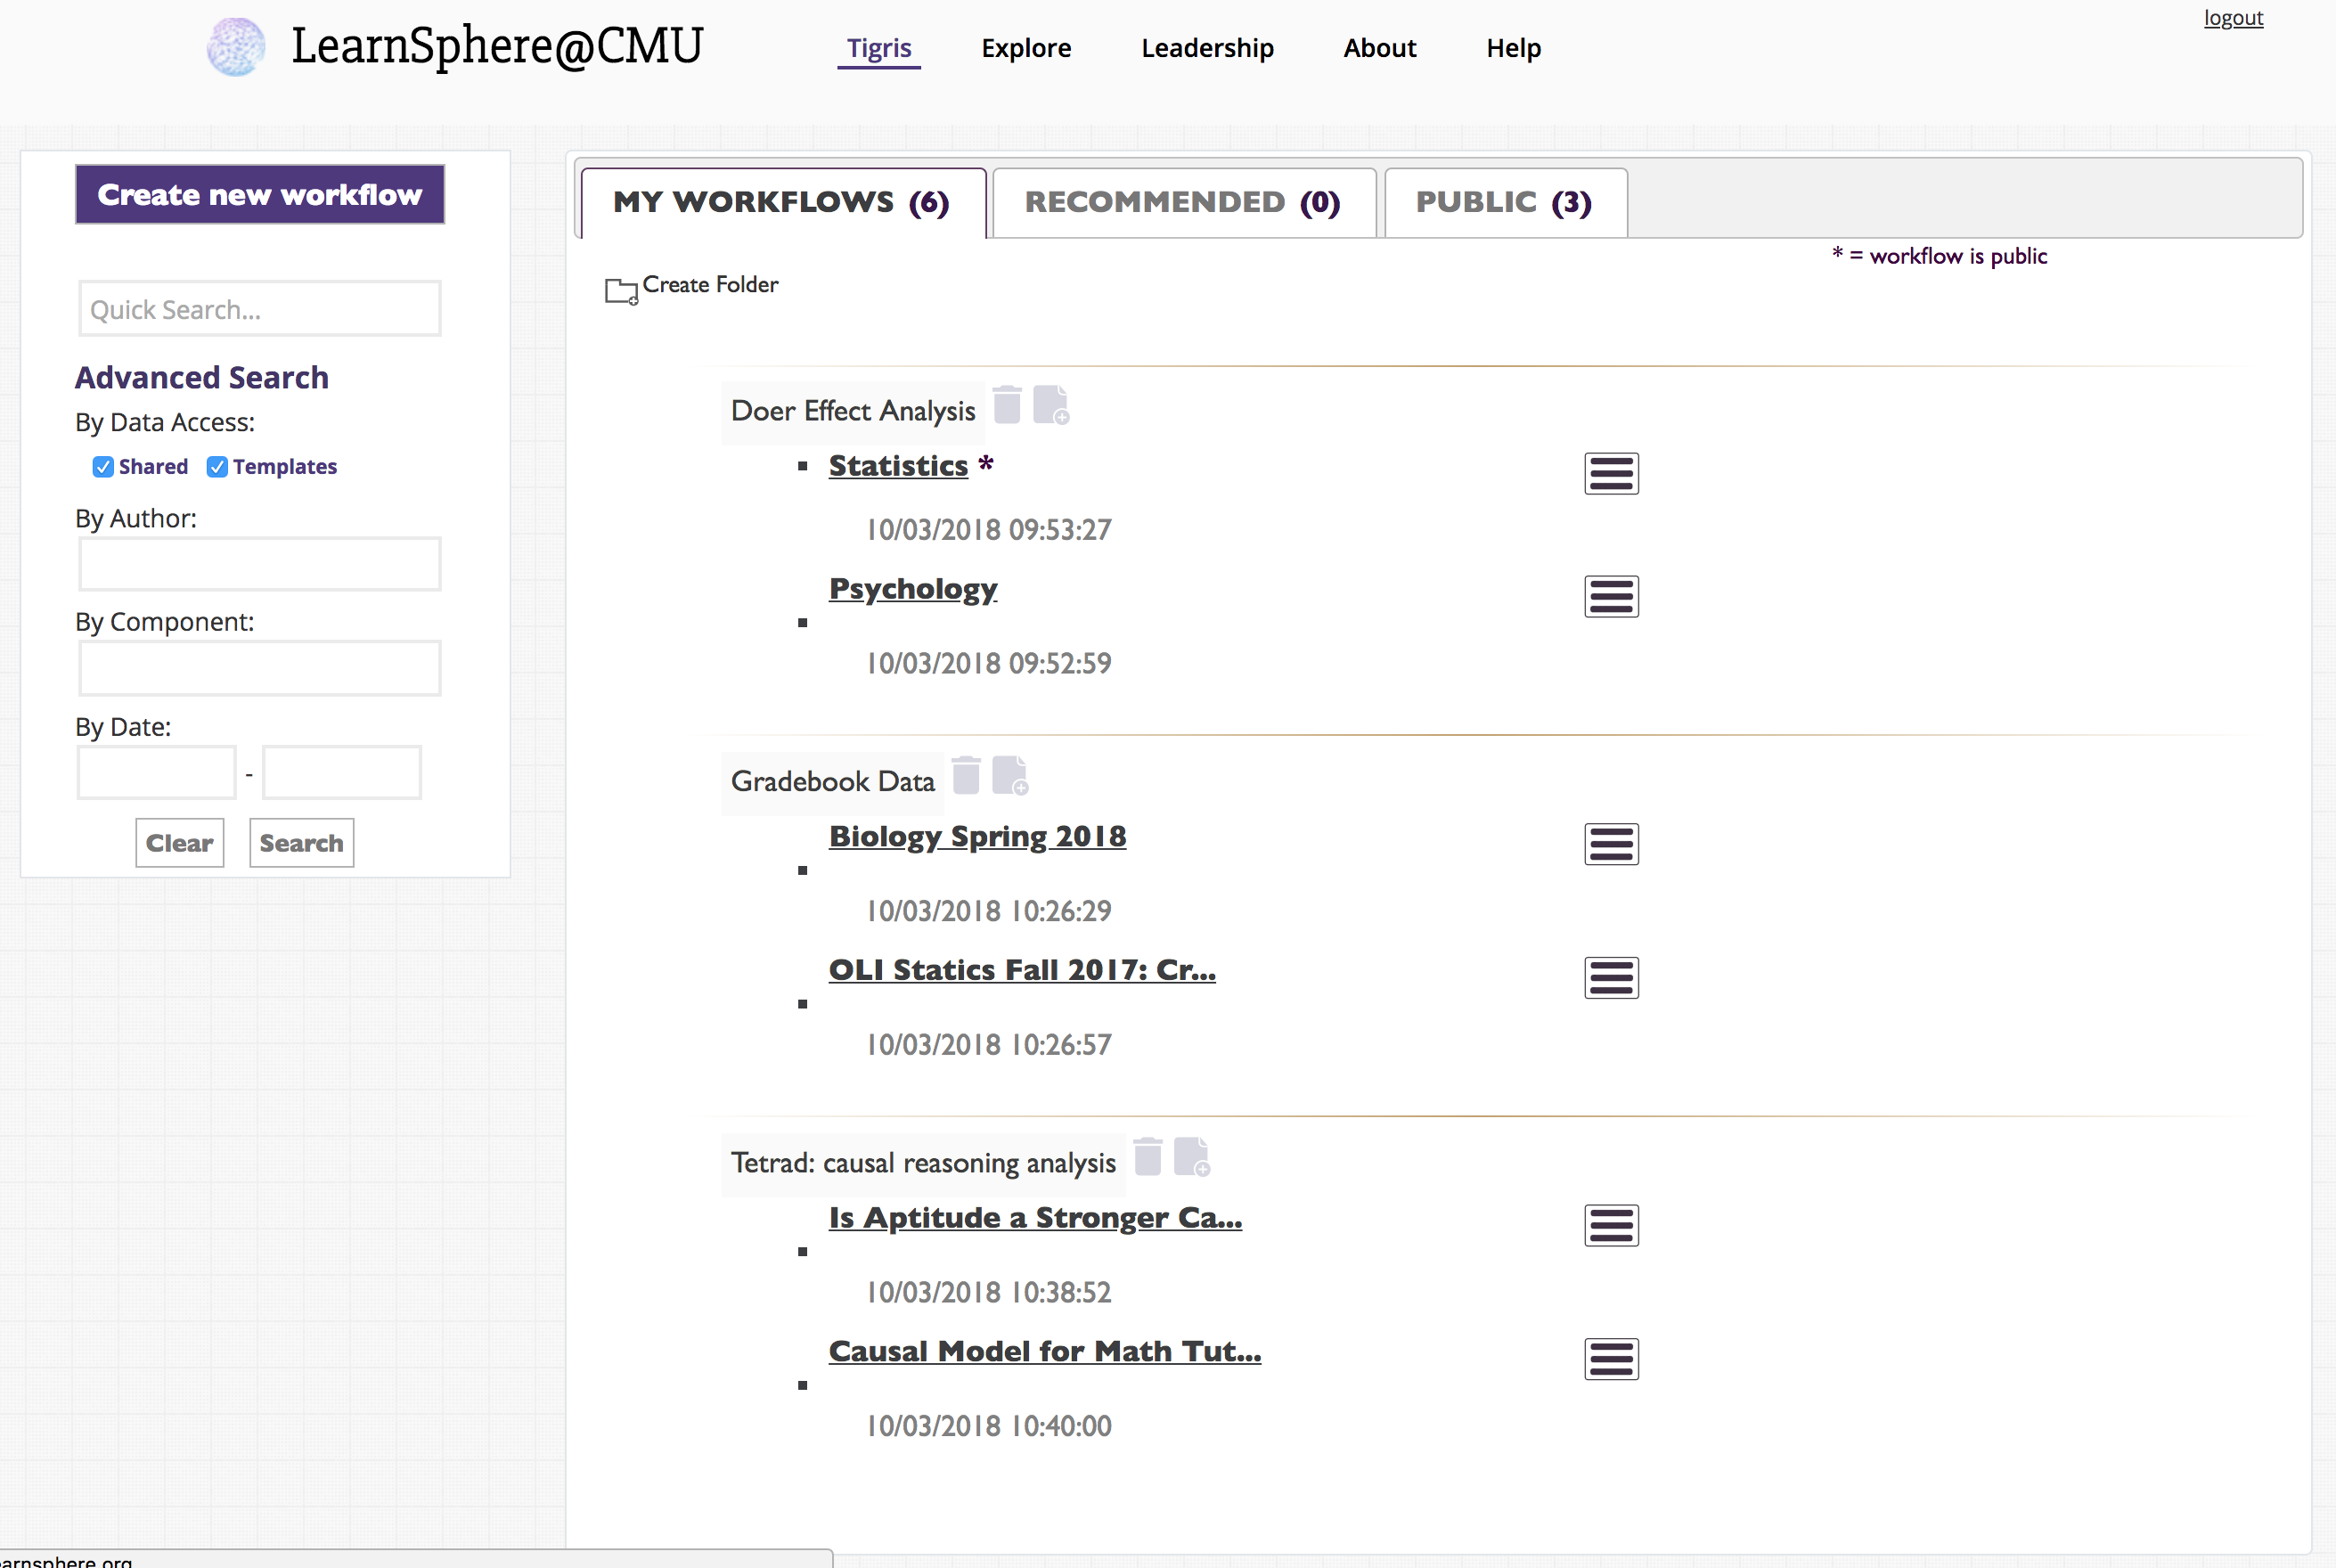
Also new to the main workflows page is an Advanced Search toolbox. The list of workflows can be filtered by owner, component, date range and access level for the data included in the workflow. The component search covers not only the component names and type (e.g., Analysis, Transform) but also workflow description, results and folders.
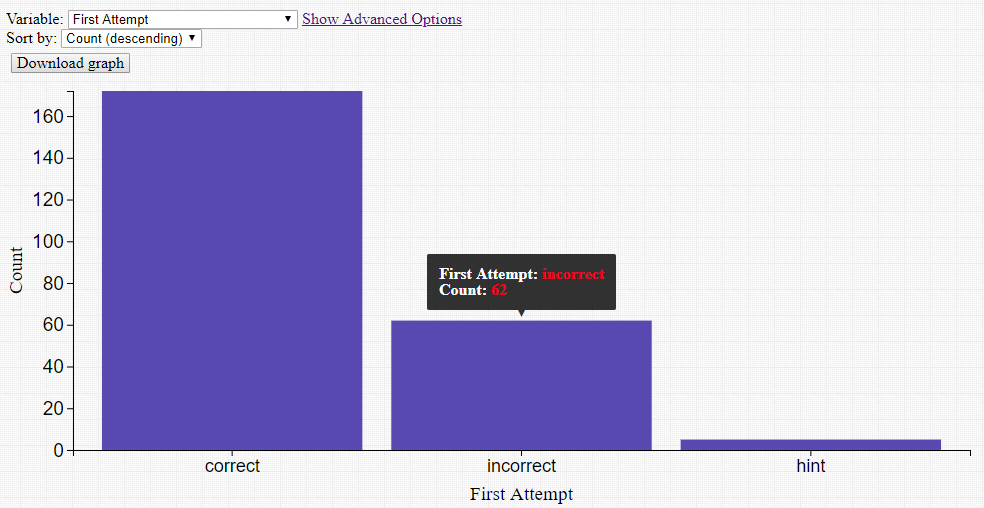
Four new visualization components have been added: Scatter Plot, Bar Chart, Line Graph and Histogram. Each requires a tab-delimited file as input. The file must have column headers, but can contain numeric, date, or categorical data. In the example below, a DataShop student-step export is used with the Scatter Plot component to visualize the number of times a student has seen a problem vs. the amount of time it took to complete a step.
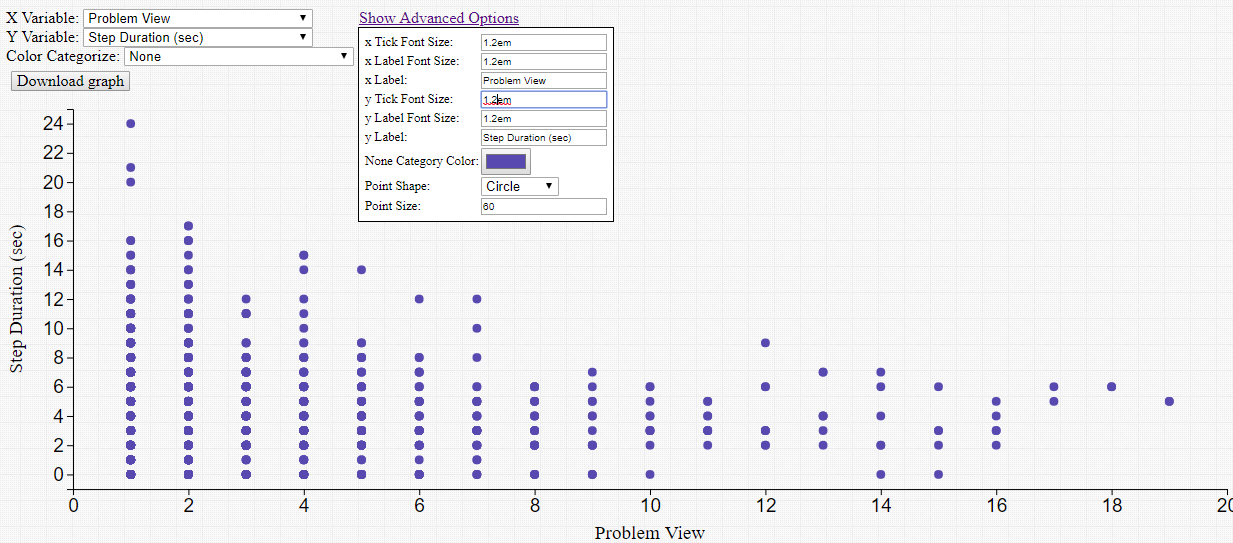
These visualization components produce dynamic content, allowing users to change both the variables that are being visualized in the output, as well as the look-and-feel of the graph, without having to re-run the entire workflow. The visualization can be downloaded as a PNG image file.
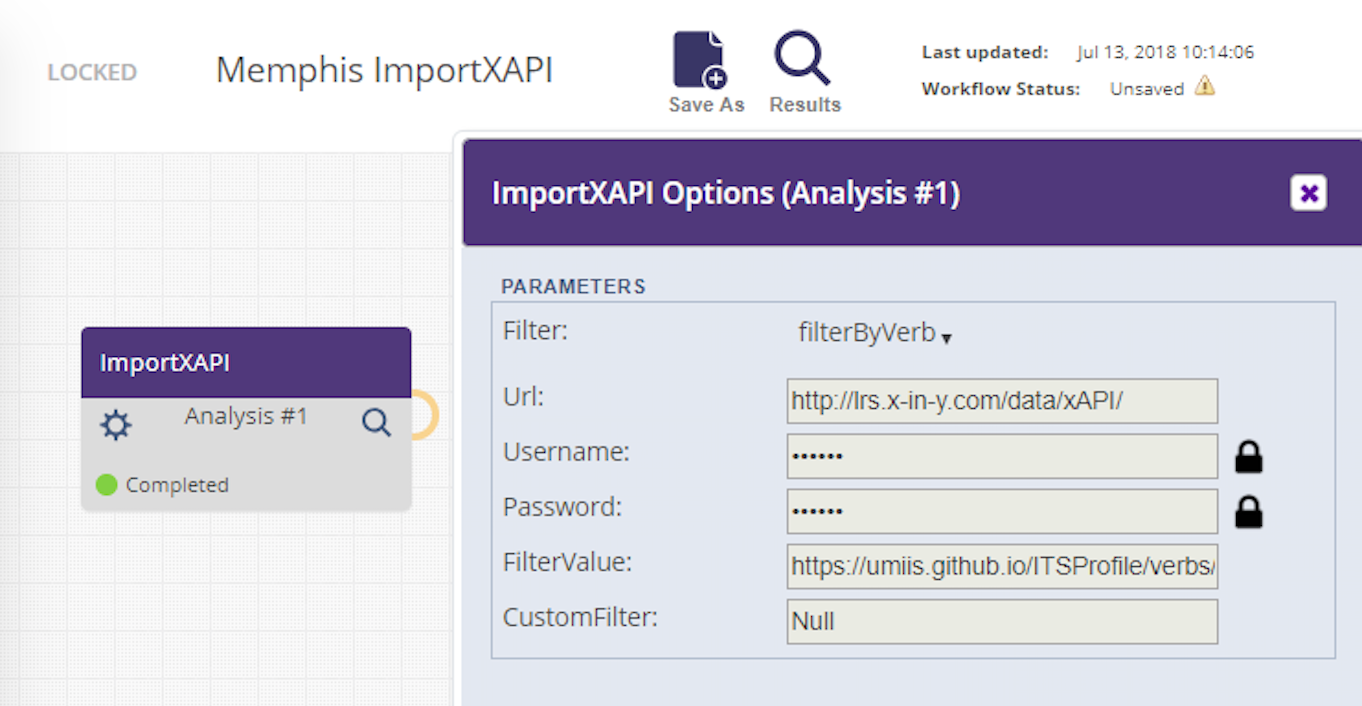
Component developers may wish to have options that contain sensitive data, e.g., login information or keys. Examples of this are the ImportXAPI and Anonymize components. For instance, in the figure below you can see that the ImportXAPI component requires a URL for the data as well as the user id and password required to access the data. With support for private options, the component author can ensure that sensitive fields such as these are visible only to the workflow owner, while other options default to 'public' and are visible to all users.
With this release you can use Web Services to programmatically retrieve LearnSphere data, including lists of workflows, as well as attributes and results for specific workflows. In the next release this functionality will be extended to allow users to create, modify and run workflows programmatically as well.
Creating a workflow from a DataShop dataset will establish a relationship between the dataset and workflow. However users may wish to link multiple datasets to a workflow and they may want to do this only after creating the workflow. There is a new "Link" icon on each workflow page that opens a dialog listing datasets that can be referenced; this is available to the workflow owner. Users viewing the workflow can click on the "datasets" link below the workflow name to see which datasets have been linked to the workflow.
To facilitate easy sharing of workflows, each workflow now has unique URL. The URL can also be bookmarked.
Friday, 13 July 2018
LearnSphere 2.0 and DataShop 10.2 released!
This release features more improvements to Tigris, an online workflow authoring tool which is part of LearnSphere. These improvements make it possible for users to better contribute data, analytics and explanations of their workflows.
- Tree structure for the list of components
- Single Import
- Multiple files per input node
- Multiple predicted error rate curves on a single Learning Curve graph
- There are several new components available, including:
- DataStage Aggregator (Transform)
- Anonymize (Transform)
- AnalysisFTest5X2* (Analysis)
- AnalysisStudentClustering* (Analysis)
- CopyCovariate* (Transform)
- ImportXAPI* (Transform)
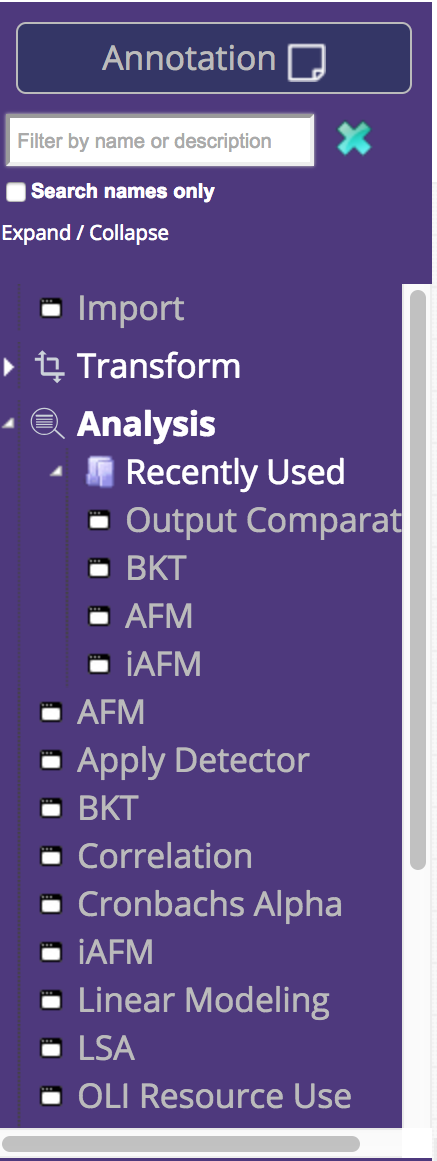
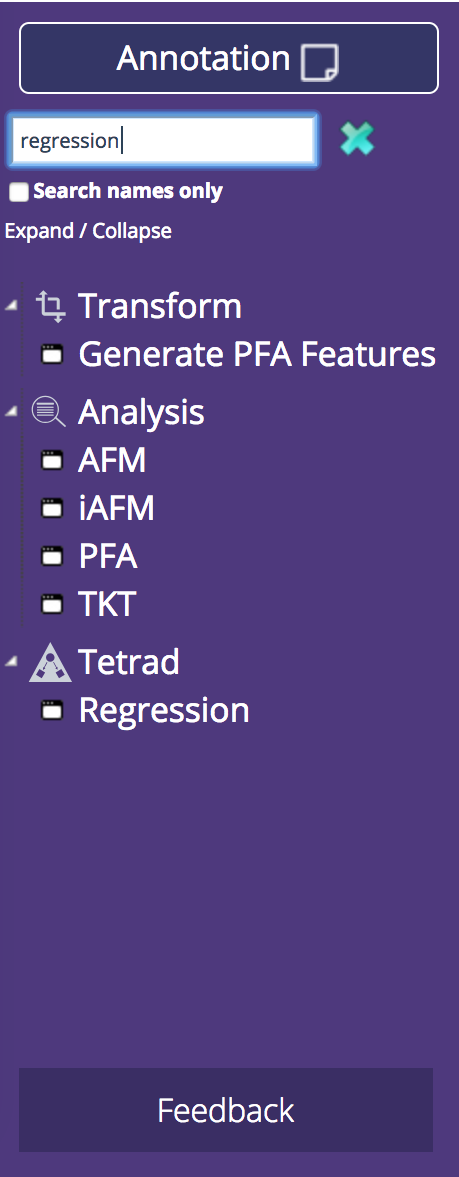
The Tigris components, still in the left-hand pane, are now displayed in a tree structure. The categories and the organization of the components is the same, and in addition, each category has a "Recently Used" folder. This makes it easier to find the components you most frequently use. We've also added the ability to search for components. The list will update to only show components relevant to the search term. Users can search components by name or any relevant information, e.g., the component author or the input file type.
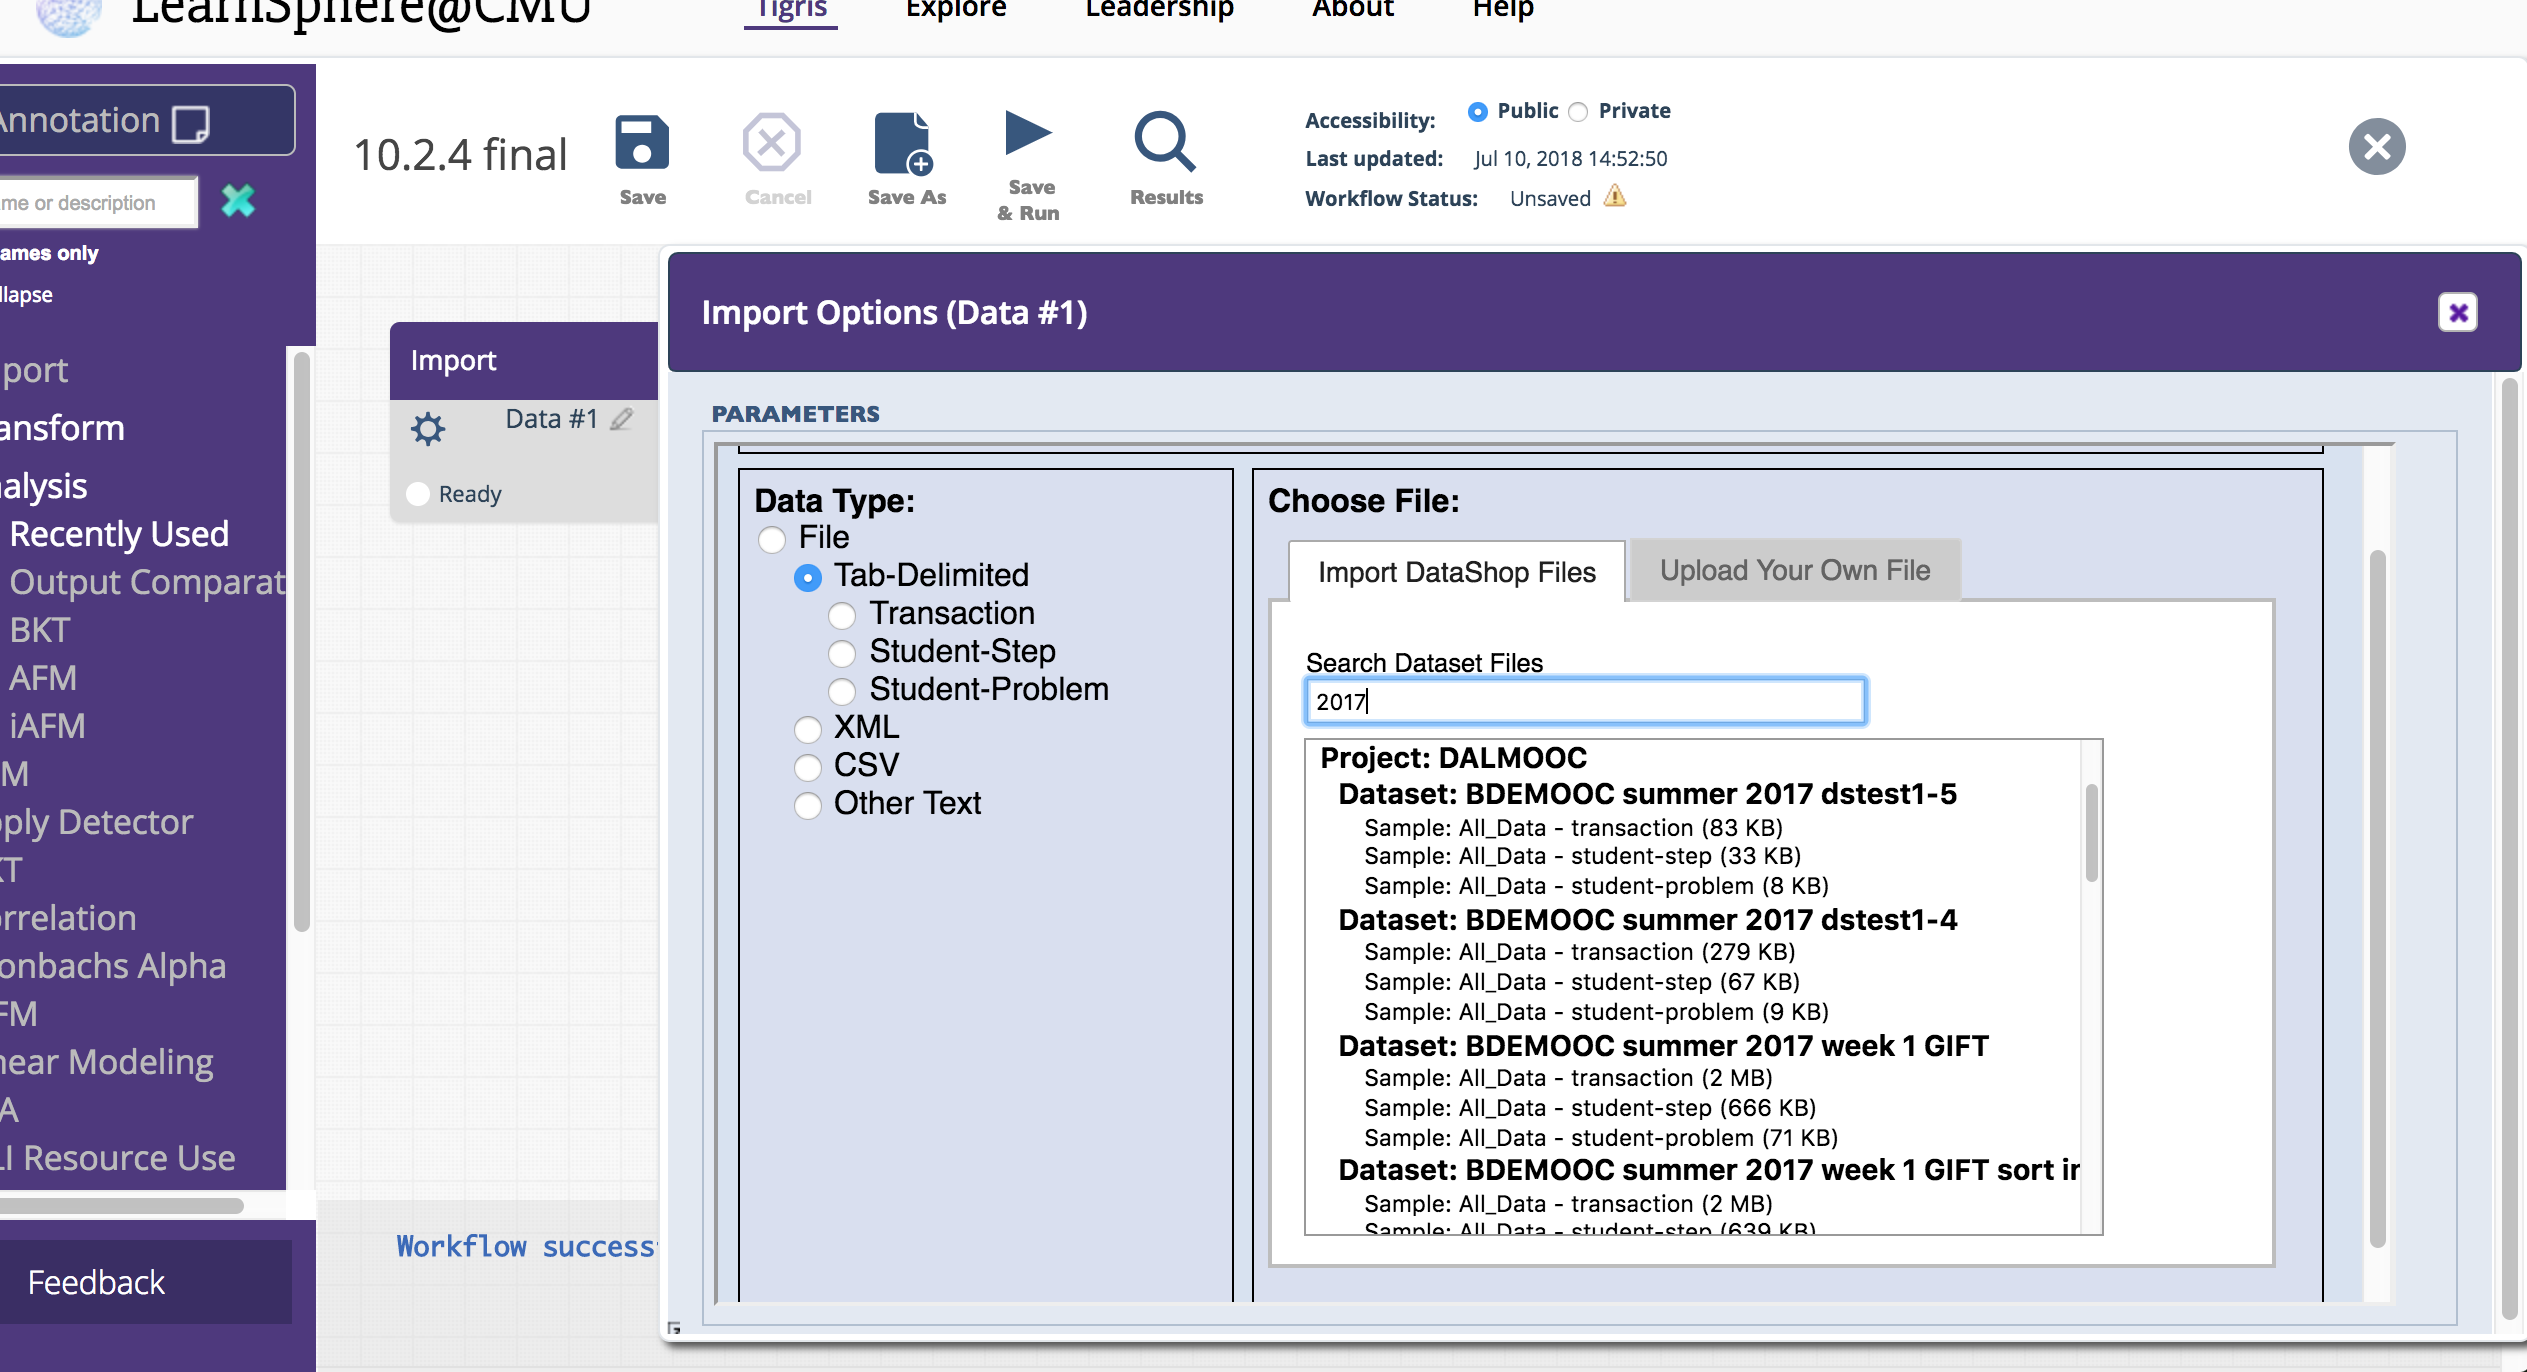
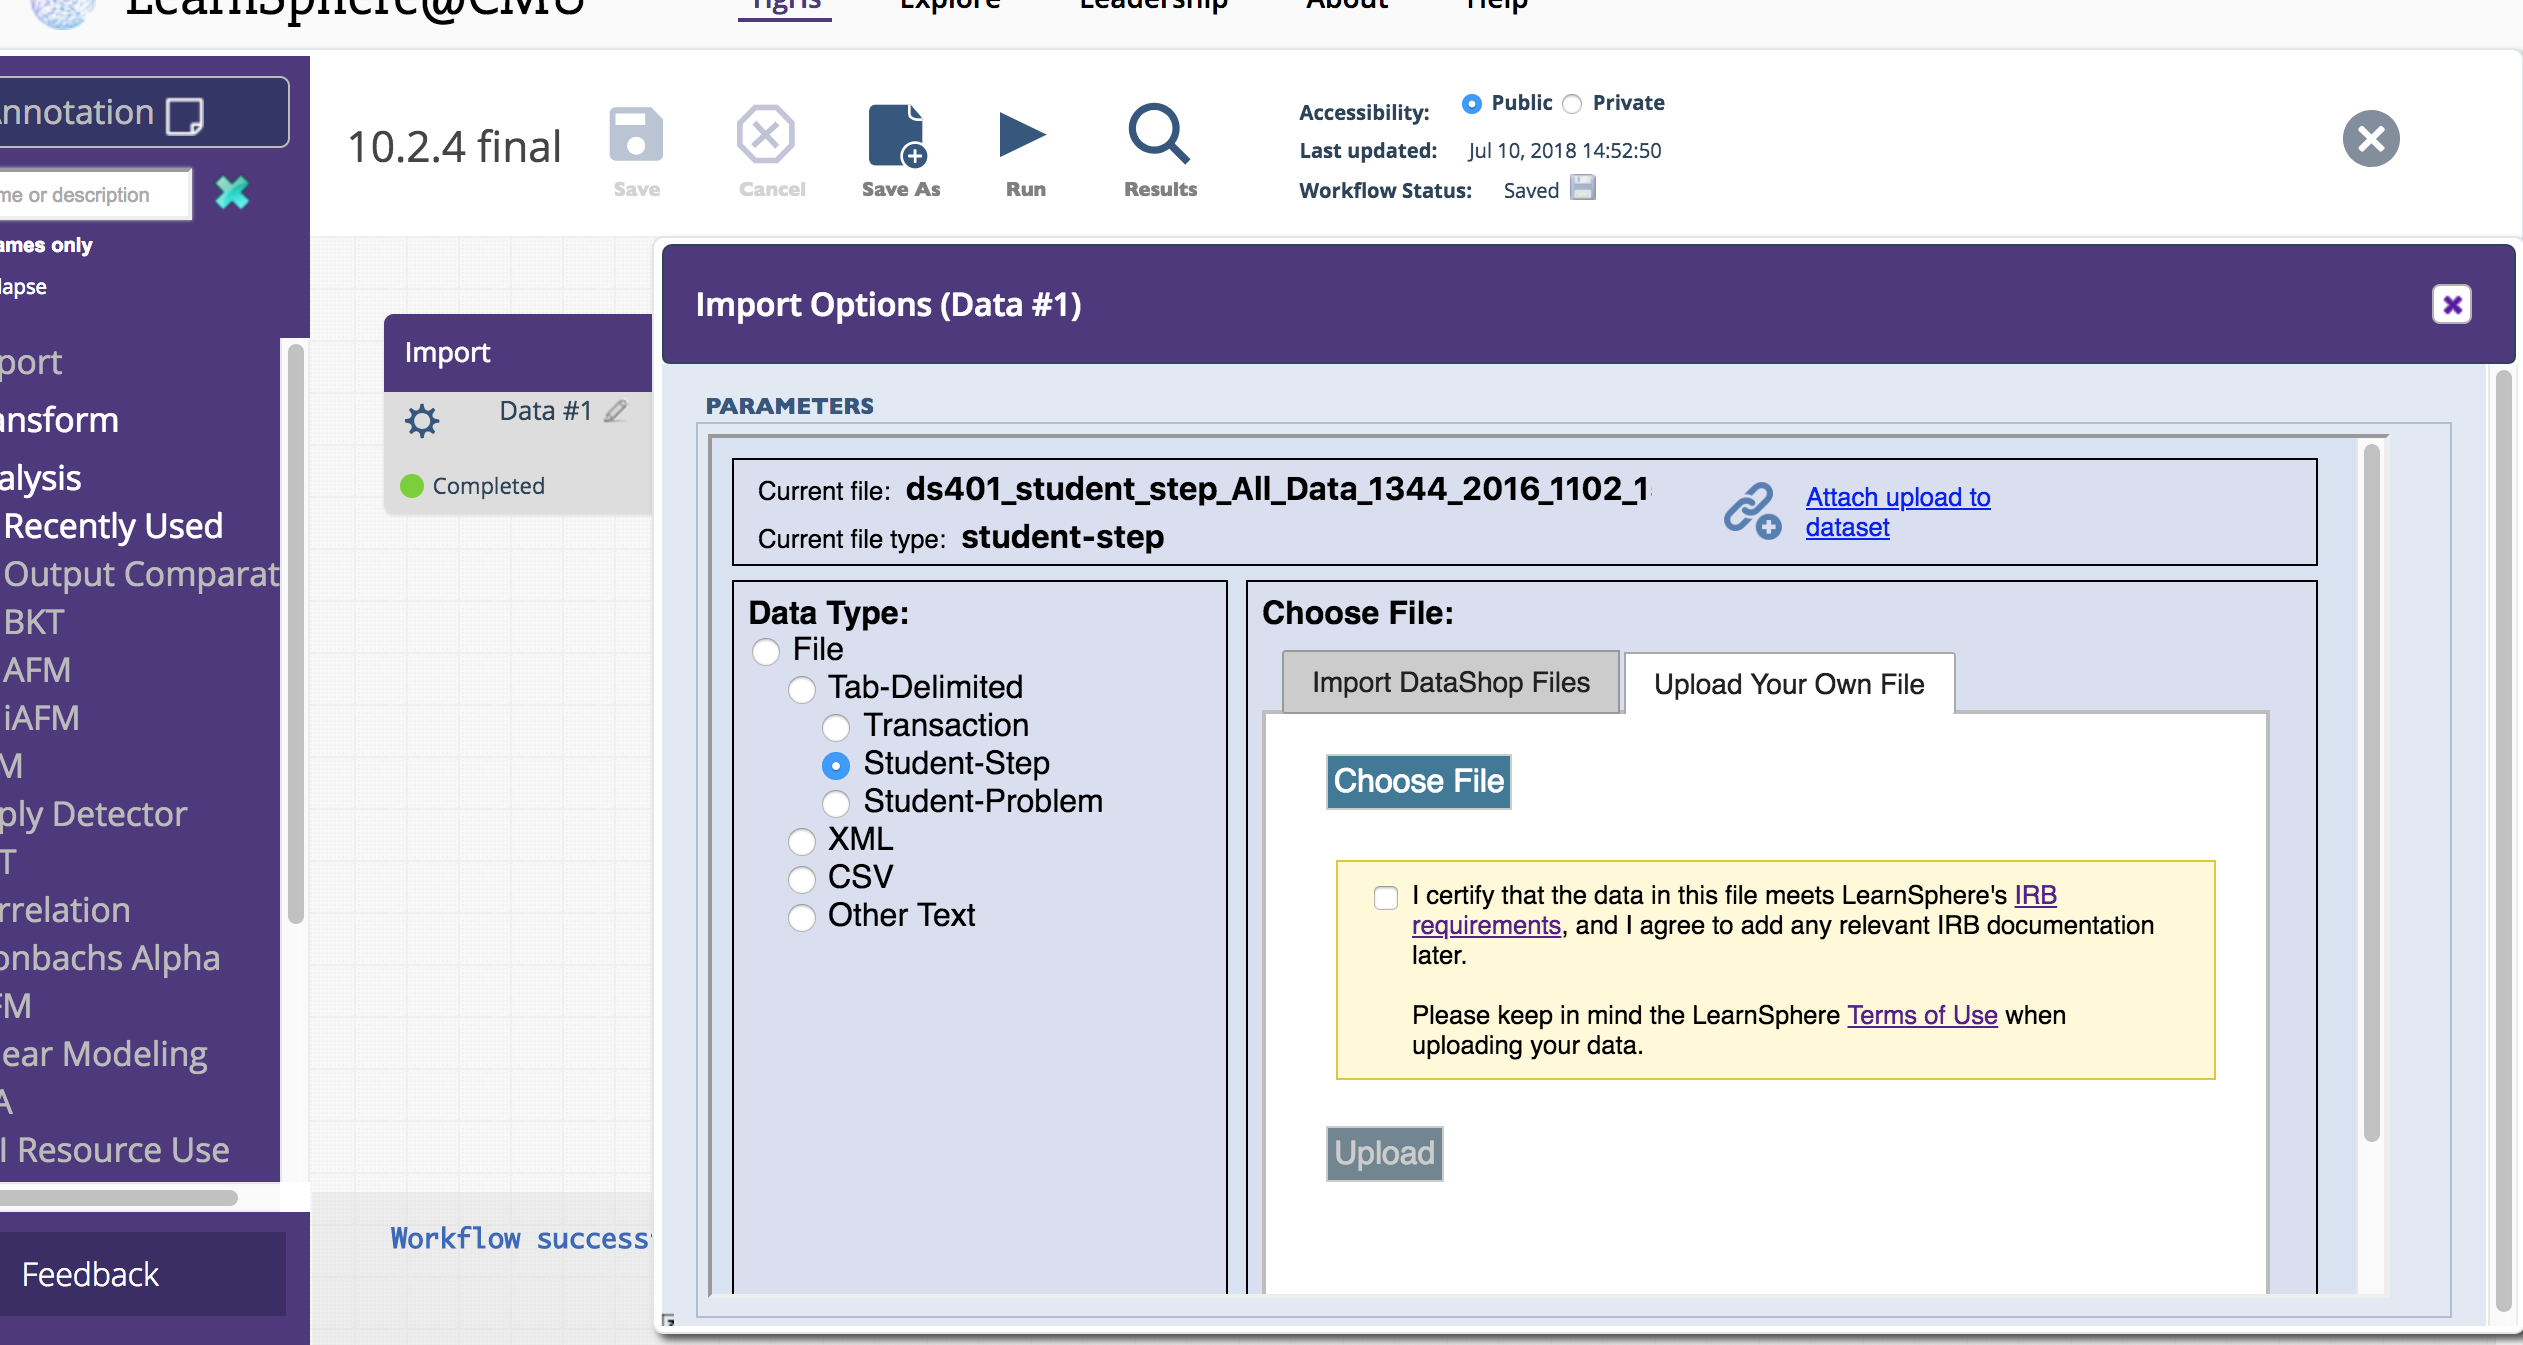
We consolidated Import functionality into a single component. Now, choosing a data file is simpler because the file type hierarchy is built into the import process. In the new Import options panel, you'll be prompted to specify your file type, which will then filter the list of available, relevant DataShop files. Alternatively, you can upload your own data file in the other tab, as shown below.
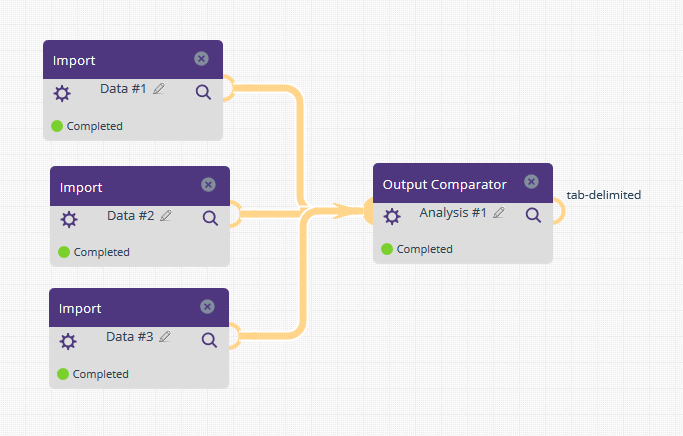
Component input nodes are no longer restricted to a single file. This means that components which analyze data across files are no longer limited by their number of input nodes. For example, the OutputComparator component, which allows for visual side-by-side comparison of variables across tab-delimited, XML or Property files, now supports an unlimited number of input files.
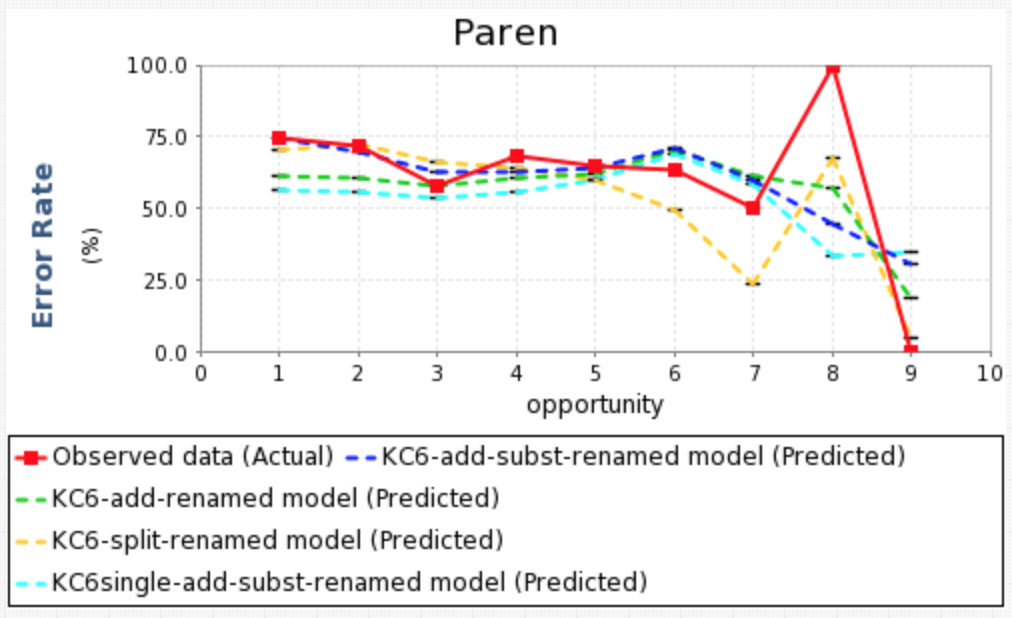
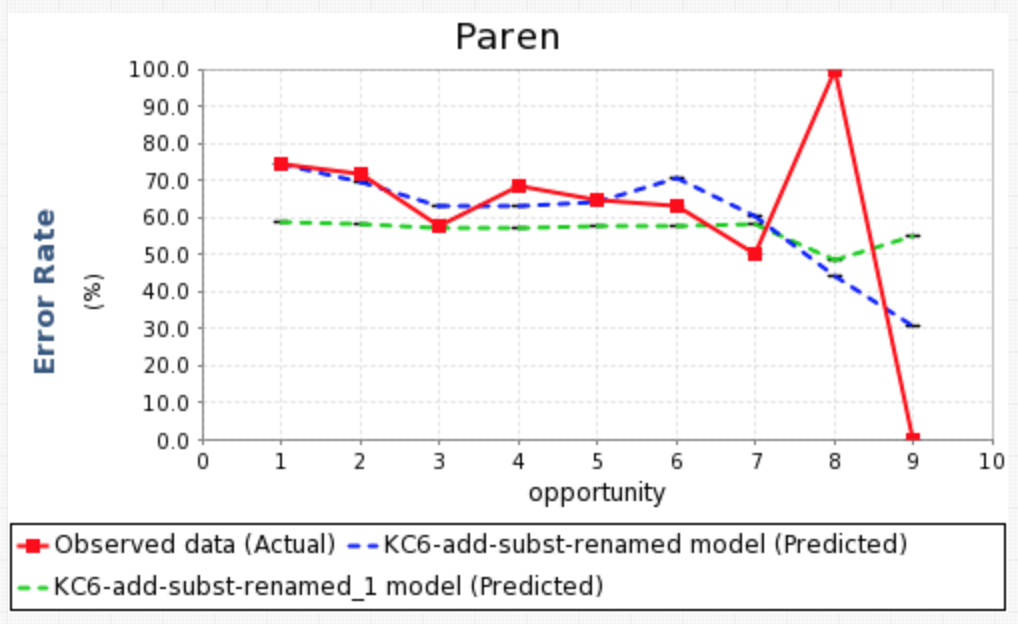
The Learning Curve component now allows users to plot multiple predicted error rate curves on a single graph. In the first example we show the predicted error rates for four different KC models, generated using the Analysis AFM component. Because this component allows for multiple input files, we can also use this component to show the predicted error rate curves across different analyses, in this case, AFM and BKT (shown in the second figure).
The DataStage Aggregator component aggregates student transaction data from DataStage, the Stanford dataset repository from online courses.
The Anonymize component allows users to securely anonymize a column in an input CSV file. The generated output will be the original input data with the specified column populated with anonymized values. The anonymous values are generated using a salt (or "key" value). This component is useful when anonymizing students across multiple files, consistently.
* These components are available at LearnSphere@Memphis.
Monday, 9 July 2018
Attention! DataShop downtime for release of v10.2
DataShop is going to be down for 2-4 hours beginning at 8:00am EST on Friday, July 13, 2018 while our servers \ are being updated with the new release.
Friday, 23 March 2018
LearnSphere 1.9 and DataShop 10.1 released!
This release features improvements to Tigris, an online workflow authoring tool which is part of LearnSphere. These improvements make it possible for users to better contribute data, analytics and explanations of their workflows.
- Workflow Component Creator
- Returning Tigris users will find many usability and performance enhancements have been made.
- We have improved processing throughput, as well as the security of Tigris workflows, by moving to a distributed architecture and off-loading component-based tasks to Amazon's Elastic Container Service.
- Tigris and DataShop now support a LinkedIn login option.
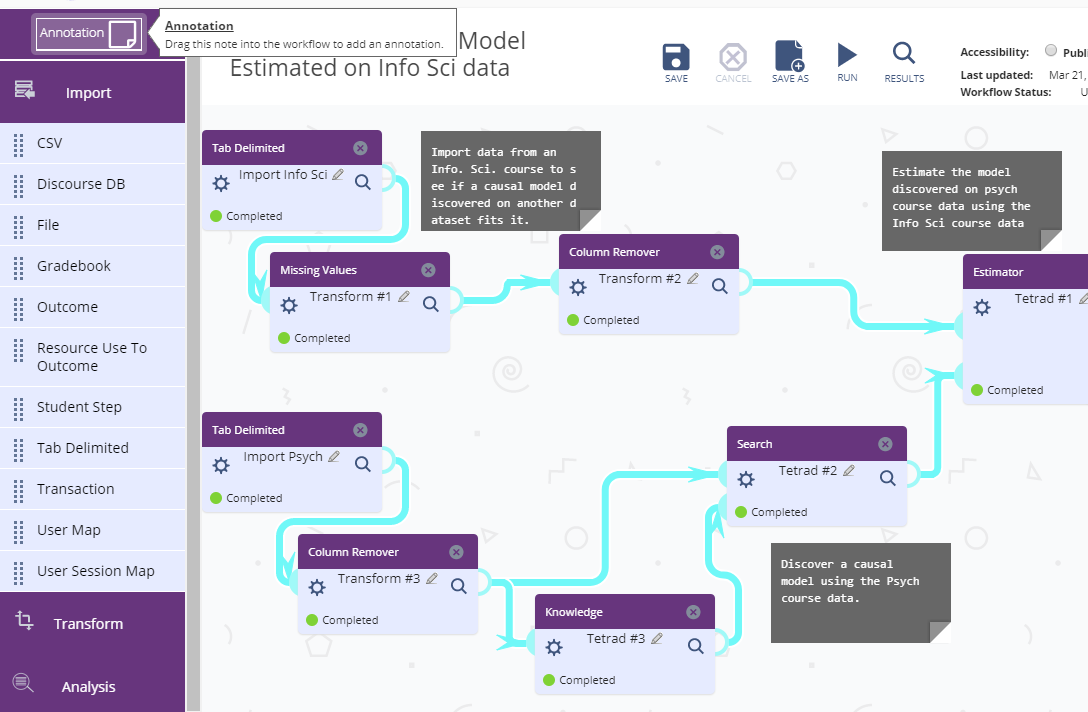
- Users can now annotate their workflows with additional information about the workflow -- the data being used, the flow itself and the results. The owner of a workflow can add sticky notes to the workflow and these annotations are available to other users viewing the workflow.
- New Analytic component functions
- The Tetrad Graph Editor component is now a graphical interface, replacing the text-based graph definition. Users can now visually define the graph.
- The Tetrad Knowledge component now has a drag-and-drop interface, allowing users to place variables in specific tiers.
- Component options with a large number of selections will now open a dialog that supports multi-select and double-click behaviors.
- There are four new components available:
- Apply Detector (Analysis)
- Output Comparator (Analysis)
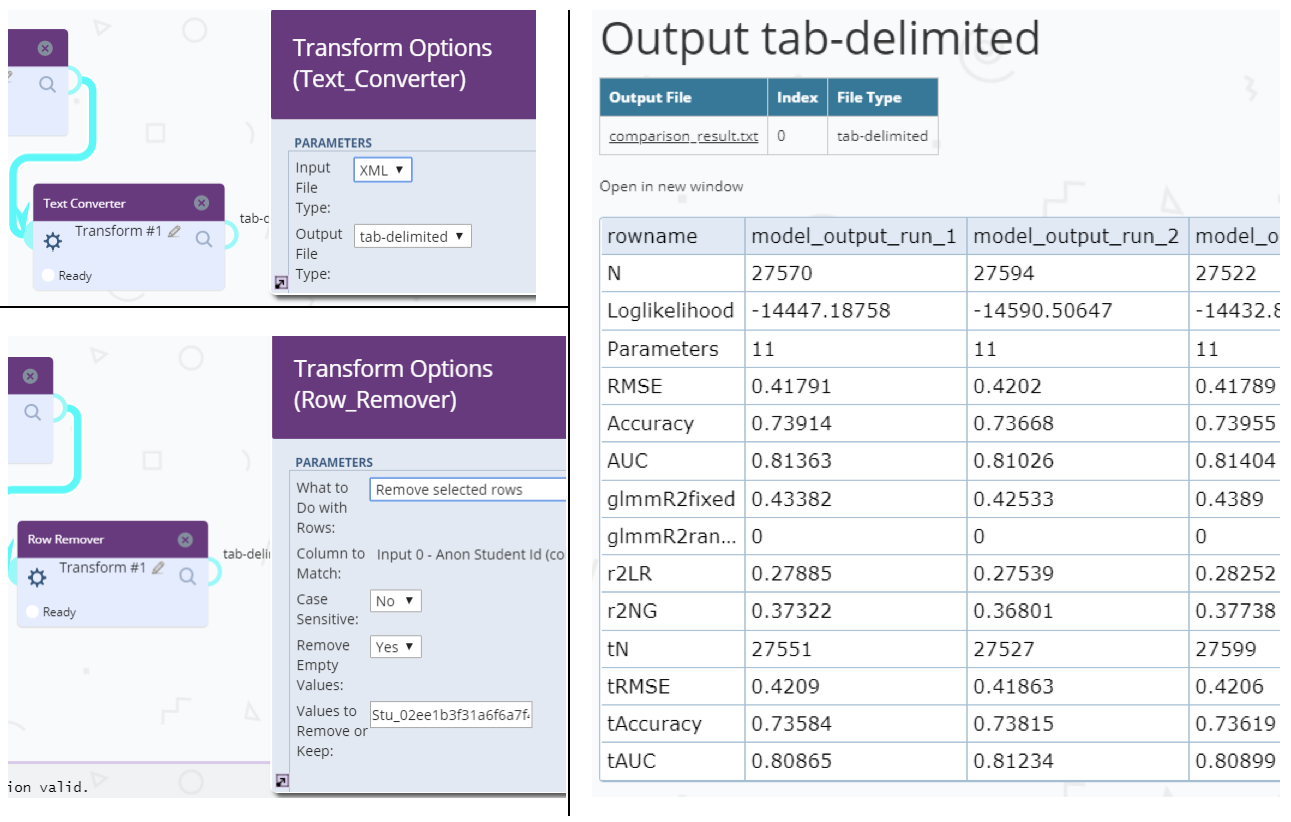
- Text Converter (Transform)
- Row Remover (Transform)
We invite users to contribute their analysis tools and have written a script that can be used to create workflow components. The script can be found in our GitHub repository, along with the source code for all existing components. The component documentation includes a section about running the script. In addition, other changes make it easier to author new components: there is built-in support for processing zip files, component name and type restrictions have been relaxed, and arguments can easily be passed to custom scripts.
More information about the detectors available for use in the Apply Detector component, and papers that have been published about them, can be found here. The detectors can be used to compute particular student model variables. They are computational processes -- oftentimes machine-learned -- that track psychological and behavioral states of learners based on the transaction stream with the ITS.
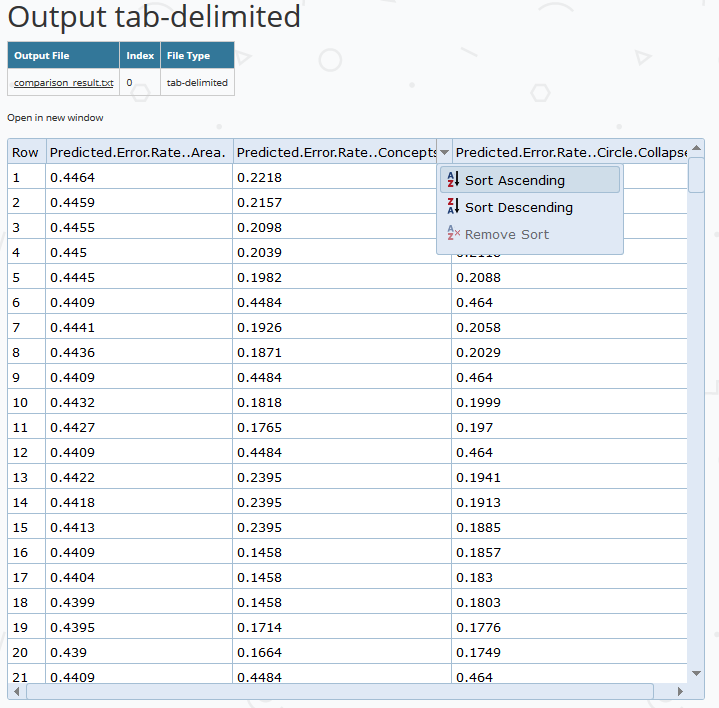
The Output Comparator provides a visual comparison of up to four input files. Supported input formats are: XML, tab-delimited and (key, value)-pair properties files. The output is a tabular display allowing for a side-by-side comparison of specified variables.
The Text Converter is used to convert XML files to a tab-delimited format, a common format for many of the analysis components in Tigris. The Row Remover allows researchers to transform a tab-delimited data source to meet certain criteria for a dataset. For example, the user can configure the component to remove rows for which values in a particular column are NULL or fall outside the acceptable range.
Saturday, 16 March 2018
Attention! DataShop downtime for release of v10.1
DataShop is going to be down for 2-4 hours beginning at 8:00am EST on Friday, March 23, 2018 while our servers are being updated with the new release.