About
Downloads
- Cheat Sheet
- Data Management Plan Resources
- Logging Format (XSD/DTD)
- Logging Libraries
- Web Services
- XML Validator Tool
DataShopa data analysis service for the learning science community |
||||
|
LearnSphere's DataShop provides two main
services to the learning science community.
Researchers can rapidly access standard reports such as learning curves, as well as browse data using the interactive web application. To support other analyses, DataShop can export data to a tab-delimited format compatible with statistical software and other analysis packages. Launch DataShopCase Studies
Watch a video on how DataShop was used to
discover a better knowledge component model of student learning. Read more ...
Systems with data in DataShop
Browse a list of applications and projects that have
stored data in DataShop, and try out some of the tutors and games. Read more ...
Datashop News
Sunday June 2, 2024
DataShop 11.0 released!A facelift for DataShop! Even though we haven't kept up with the release announcements, there have been several releases over the years. This one, though, is special because it brings a much-needed facelift to DataShop. Same great content and tools but a shiny new look. Let us know what you think! Saturday February 27, 2021
DataShop 10.7 released!
Users can now search for data based on a variety of dataset properties, associations, and metrics. The site-wide search is incorporated into the new search page for searching help pages, files, and papers. Below the site-wide search, the new Dataset Search utilizes over 20 attributes to filter datasets, such as the Shareable status, Area and Subject of study, Tutor types, as well as other qualitative data. Dataset Search also supports filtering by quantitative metrics such as the number of Transactions, Students, Steps, Knowledge Components, and others. 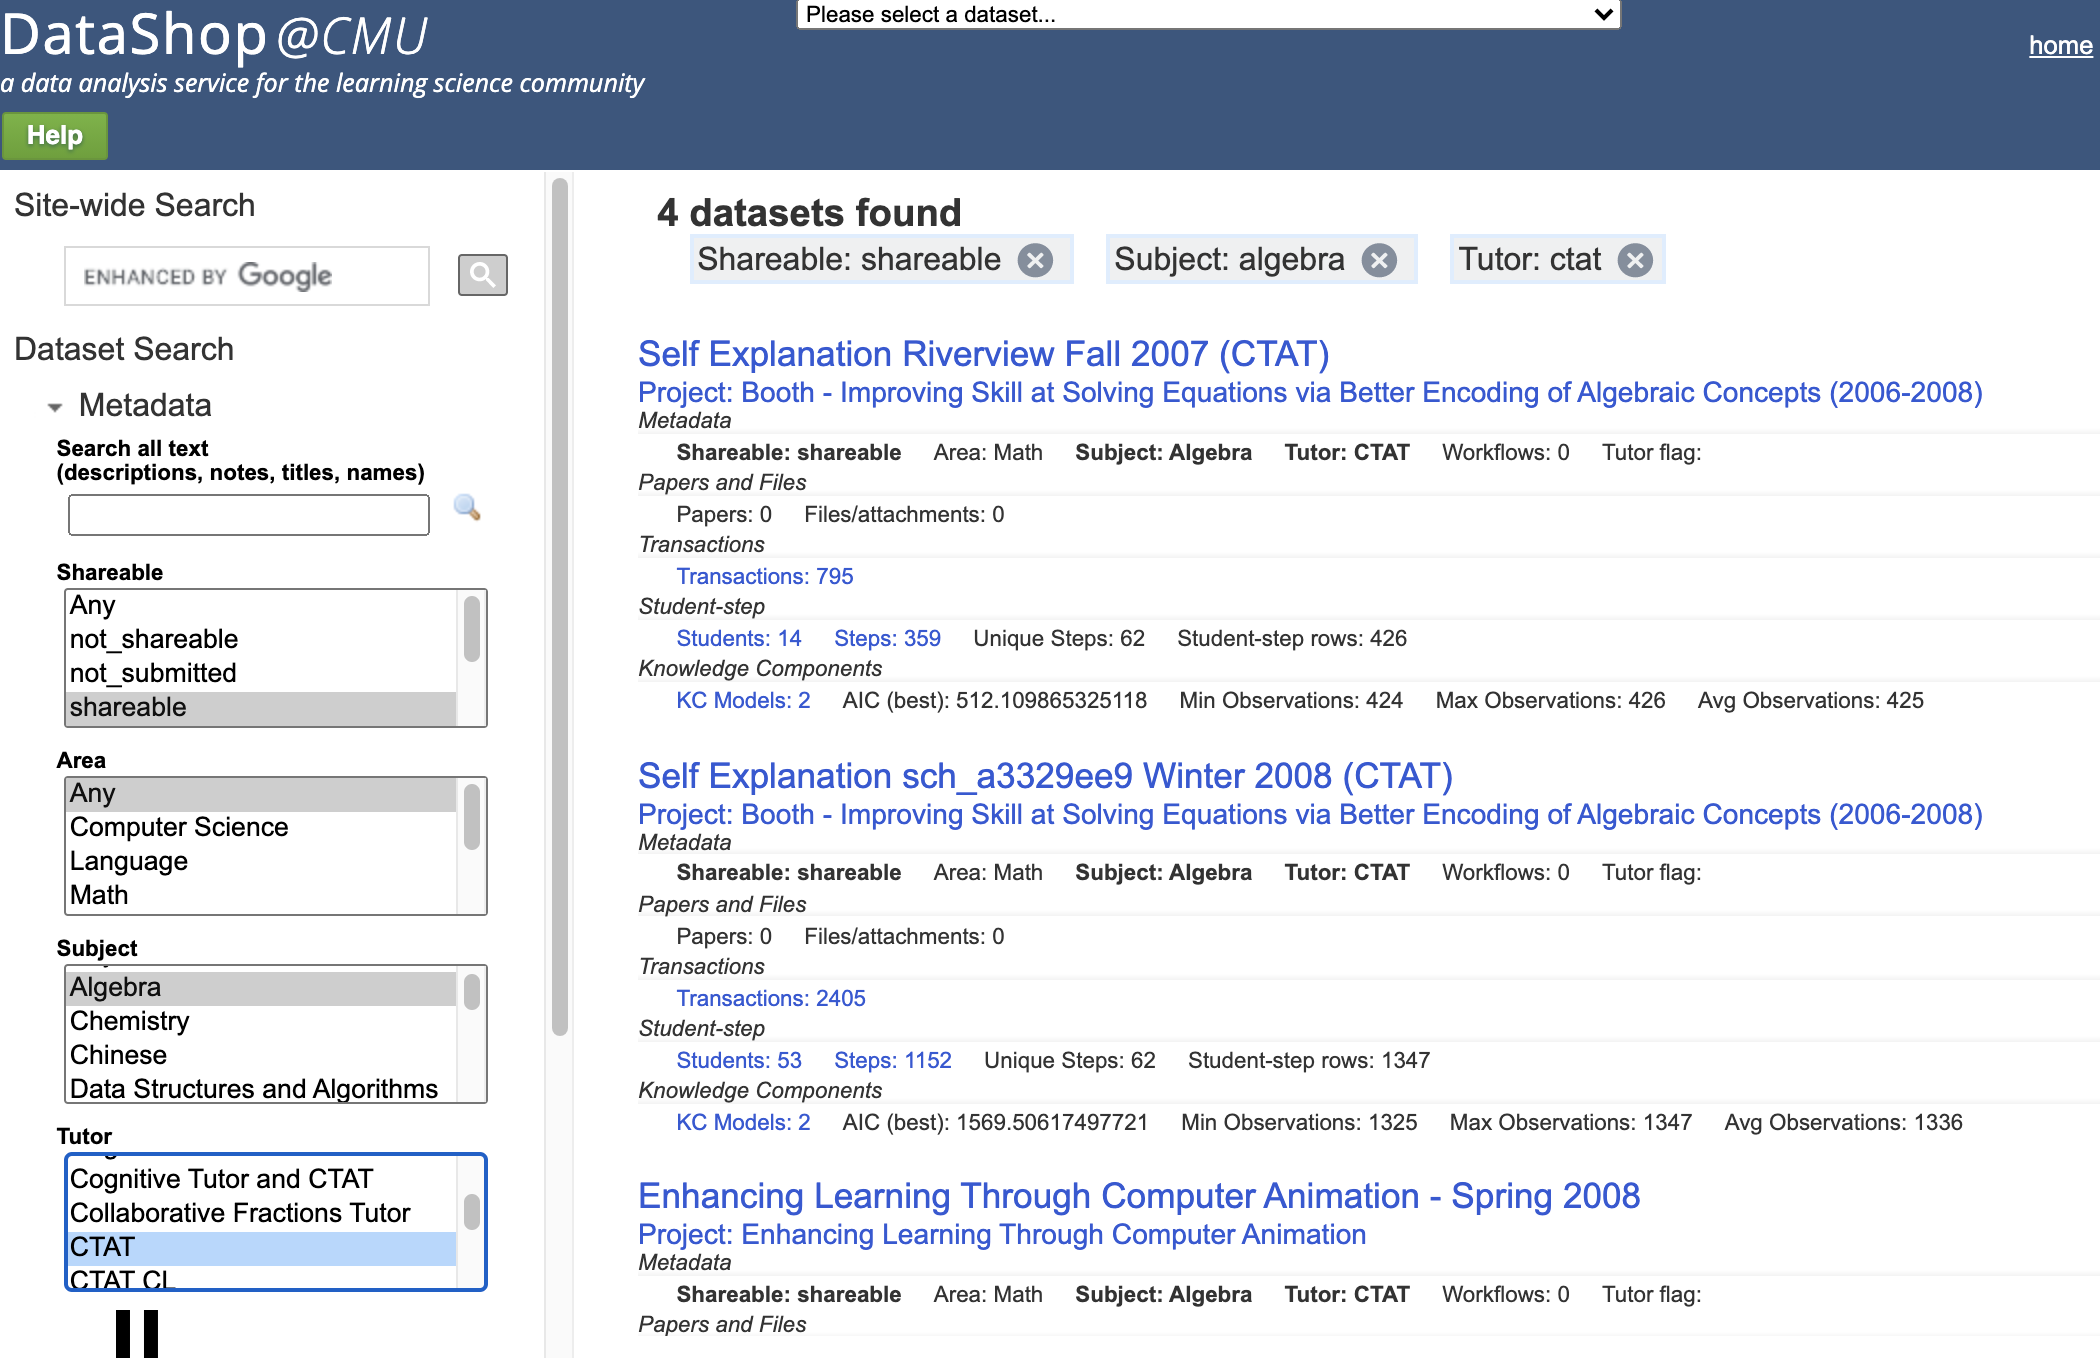
For example, in the figure above we see that there are 4 datasets that are Shareable, have a subject area of Algebra and use the CTAT tutor. Removing the Tutor filter would reveal there are 169 datasets that match the subject and shareability filters. The results include a link to each dataset as well as it's meta-data information. Access to the feature is available in the Explore section in the left-hand navigation or the search link in the upper right-hand corner. Clicking on a link in the filtered search results will include a "Back to Search" link on the page you navigate to, remembering your filter criteria.
Source code for all Tigris components can be found in our GitHub repository. The first three components were developed as part of research efforts for the PLUS Personalized Learning2 project. Two of them perform analyses on student MAP (Measures of Academic Progress) data, specifically RIT scores. This analysis component computes student MAP RIT score trends, over two years, for minoritized and non-minoritized students. RIT scores are an estimation of a student's instructional level. MAP tests are used by schools to measure student progress or growth year-to-year. 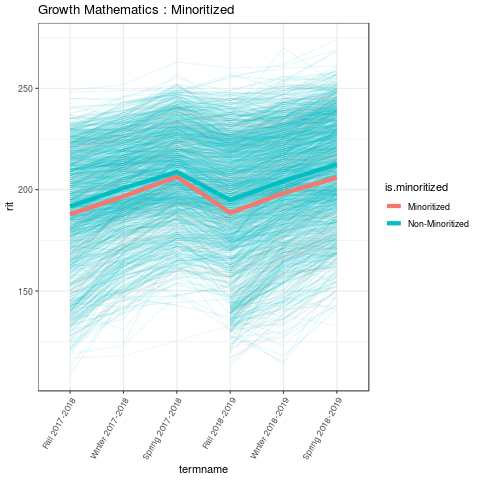
This component uses AFM (Additive Factors Modeling) to model student growth (or Learning Rate) using two years of MAP test data, considering those students who received interventions vs those that did not. 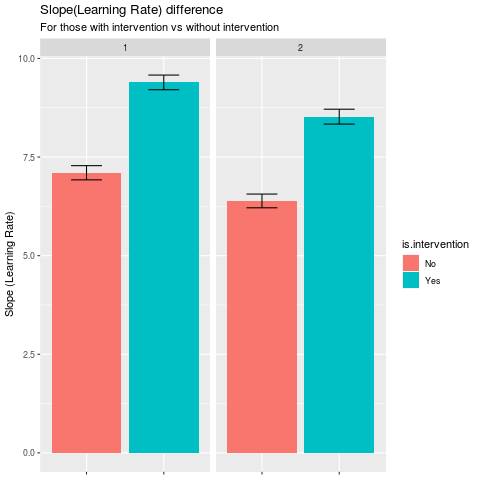
This visualization component generates four student demographic plots, displaying the distribution of students by race, gender, school and grade. 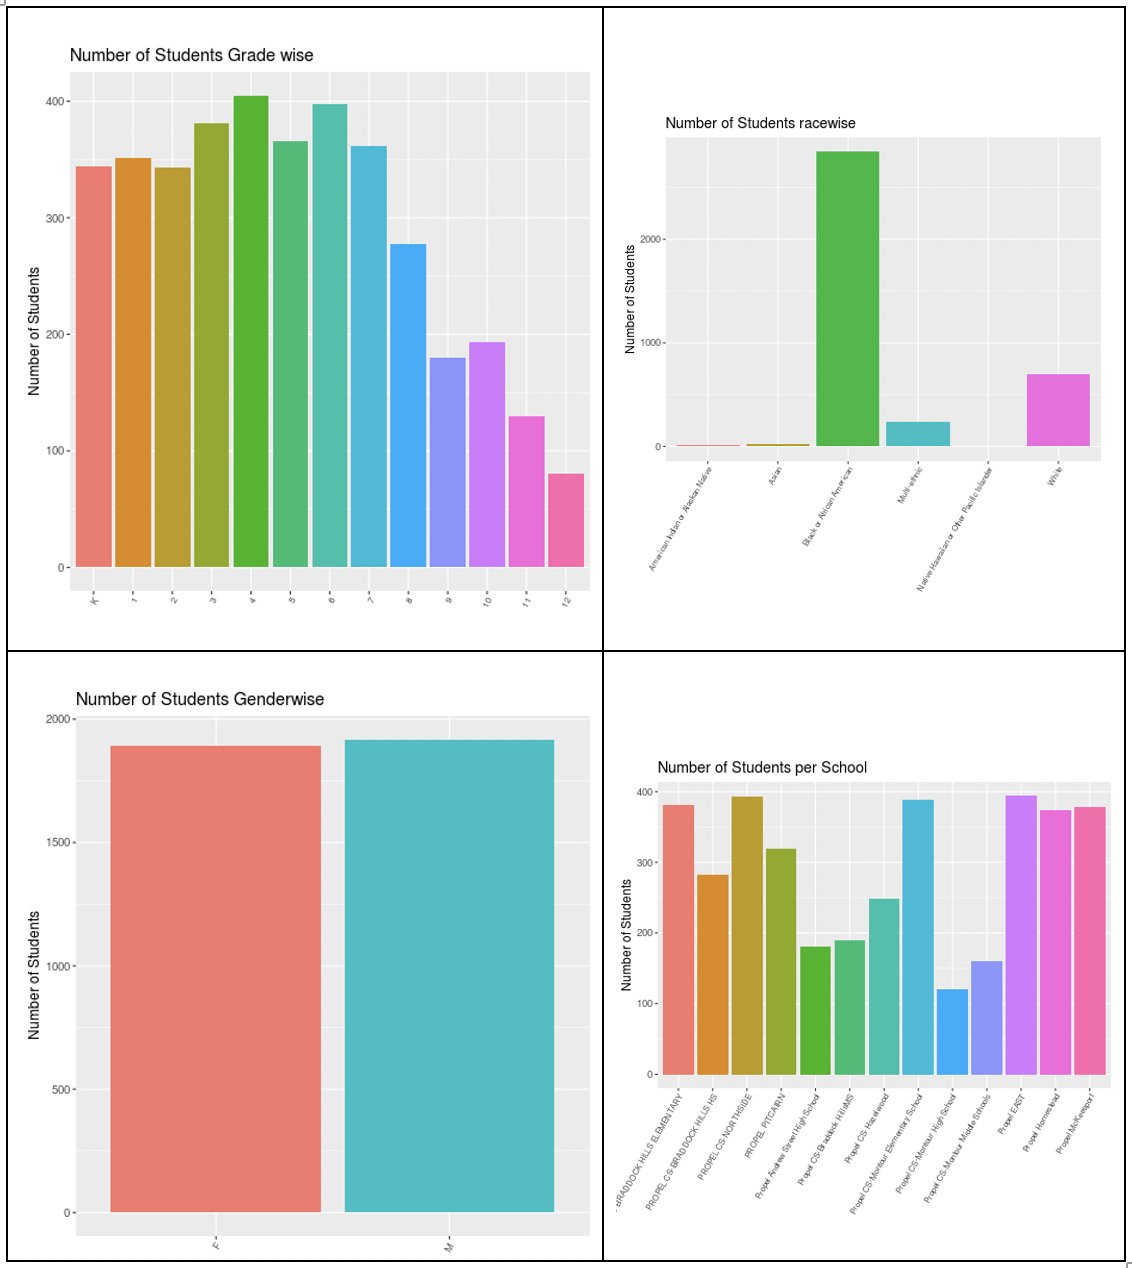
This transform component can be used to convert a multi-skill Knowledge Component (KC) model in a DataShop student-step export. The component supports either creating a new skill by concatenating two or more skills or creating multiple distinct rows (and opportunity counts) from a single multi-skill row. This allows researchers to consider alternative ways in which skills present in a dataset can be used to better model student behavior. Monday, December 9, 2019
LearnSphere 2.4 released!The focus of this release is largely back-end improvements to Tigris, the online workflow authoring tool which is part of LearnSphere. We have also added several new Tigris workflow components, many in response to feedback we have received at workshops and conferences.
Tigris now supports array types for simple data types (double, integer, string), FileInputHeaders, and enumerated types (drop-down lists). The user can define default values for each value added, as well as the minimum and maximum number of allowed values. Array types are especially useful in cases where an unknown number of arguments is desirable. In this example, a variable 'weights' is defined as an array of xs:double values, with at least two required values.
Source code for all Tigris components can be found in our GitHub repository. This R component helps to conduct RISE analyses as described in the paper The RISE Framework: Using Learning Analytics to Automatically Identify Open Educational Resources for Continuous Improvement.. For OLI datasets in DataShop, this component will generate an output file suitable for use in the RISE component. The output columns are skill name, average high-stakes error rate and average low-stakes error rate. 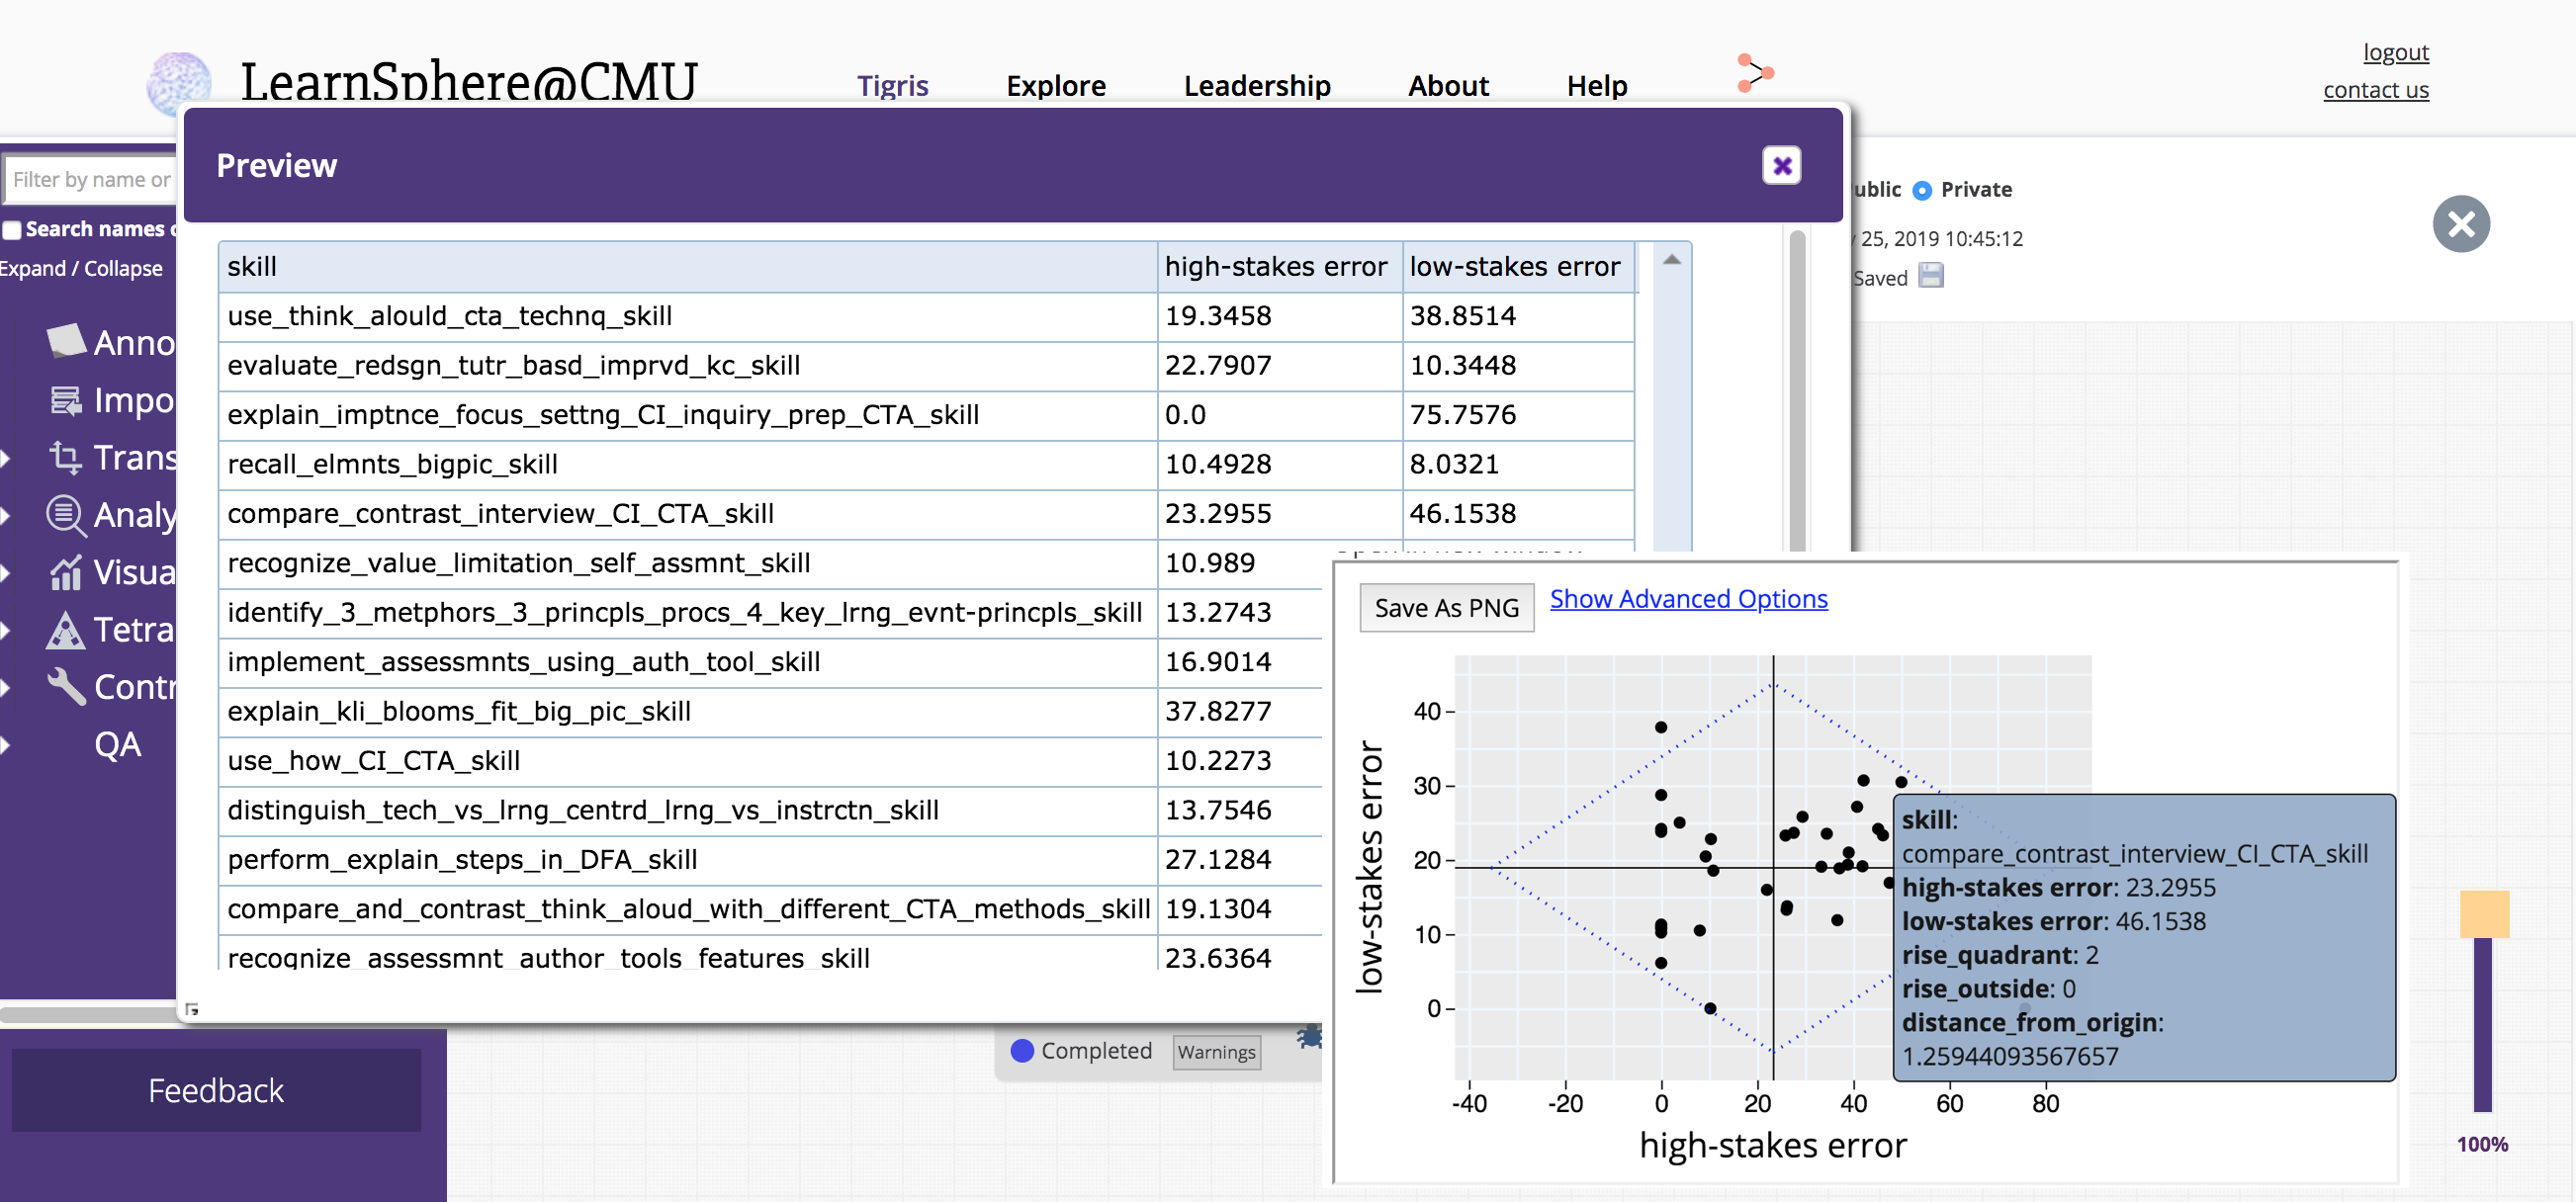
Learning Factors Analysis (LFA) performs a heuristic search to generate models of the input data. AFM (Additive Factors Model) is used to compute the metric (AIC or BIC) by which the models are compared for best fit. This component, developed as part of the PL2 project, classifies a student's progress based on their EdTech usage, accuracy information and specified goal. This component calculates performance differences for an individual course. The target use case is calculating gendered differences (or other factors) in final grade for a target course (e.g., intro physics), especially relative to grades in other courses taken by students in the target course. For reference: Koester, Grom, & McKay (2016) and Matz et al. (2017). Curriculum Pacing is a way to visualize student learning trajectories through curriculum units and sections. This visualization is suitable to quickly explore end-to-end curriculum data and see patterns of student learning. More information can be found in this paper. Given a DataShop transaction export, this component converts a multi-selection row into multiple rows of single steps and sets the Outcome values accordingly. Using a multi-selection item mapping file, an output transaction export is generated with each row labeled with the appropriate Event Type. This component supports the Tetrad Simulation functionality that can be used to generate data from an instantiated model. This component allows Tigris to support the Tetrad functionality mentioned in this tutorial by Richard Scheines. This component implements the algorithm given in Joe Beck's paper to detect if a student is wheel-spinning. The required input format is a DataShop student-step export. The editor was extended to allow users to create graphs from scratch, generating named nodes and links in the options panel. The created graph is available for download. A third output was added that includes an r2 value (a measure of how closely the data fits the regression line) and the sum of squared estimate of errors (SSE). The dataset import procedure will now process a new column called Event Type in the tab-delimited transaction data file, if present. The allowed values for this column are: assess, instruct and assess_instruct. The assess event type is considered to be a non-instructional step; the other event types cause the learning opportunity count to be incremented by 1. Using non-instructional steps, you can grant partial credit to multi-selection questions. For example, in the following question the correct answer is A and B. When a student gives an answer of B and C, they should receive partial credit for selecting B.
Wednesday, 5 December 2019
Attention! DataShop downtime for release of v10.5DataShop is going to be down for 2-4 hours beginning at 8:00am EST on Monday, December 9, 2019 while our servers are being updated with the new release. Friday, April 5, 2019
LearnSphere 2.3 released!This release features several usability improvements to Tigris, the online workflow authoring tool which is part of LearnSphere. We appreciate the feedback we have received at workshops and conferences and have addressed many of your comments in this release.
We've added support for displaying any warning messages generated by components. Components with warnings are still able to complete, yet they now indicate that something is amiss. A new output stream, the "warning" stream, is recognized by the system. If authoring a new component, warnings can be added simply by logging messages with the prefix "WARN:" or "WARNING:" to the WorkflowComponent.log or *.wfl log files. See our online documentation for more details
Allow other Tigris users to easily access work you have published referencing your workflows by attaching papers to workflows. They may be provided as URLs or uploaded directly to Tigris. An indicator shows which workflows have papers attached. Papers can be attached via the "Link" button in the workflow editor. Once added, papers may be linked to any number of workflows.
This feature can allow users to easily create a workflow to run over several different input files (or DataShop datasets). Copy and paste one or more components to extend a workflow or select groups of components to rearrange them, as a group, in your workspace. You can select components with left-click and drag to create a selection rectangle, or select components by clicking with the ctrl or ⌘ (command) keys. Data and options are retained during a copy/paste operation.
Attaching an imported file to a DataShop dataset allows that file to be used in other workflows. With this release, new DataShop projects and datasets can be created directly from the Import component.
We've added a progress bar for uploading larger files.
Friday, January 4, 2019
LearnSphere 2.2 released!This release features further improvements to Tigris, the online workflow authoring tool which is part of LearnSphere.
We have added support for tagging workflows and extended our search capabilities to include tags.
Most Tigris components were developed to generate debugging information, especially in the case of an error. This debugging output is now available to users by clicking on the bug
We have added infrastructure that allows component developers to annotate their code and provide progress feedback to users. Currently the Join component supports this, with plans to include it in an Aggregator component being added in the next release. Information about how to instrument your component to take advantage of this feature can be found in the "Component Progress Messages" section of our online documentation.
The DataShop web service was extended to support export of dataset KC models. In the near future, the OLI LearningObjective to KnowledgeComponent component will allow users to specify a DataShop dataset that they wish to generate a KC model for and have that new model generated and imported into the specified dataset. This new webservice facilitates this. Tuesday, October 30 2018
LearnSphere 2.1 released!This release features improvements to Tigris, the online workflow authoring tool which is part of LearnSphere.
Returning users will recognize that the layout of the main workflows page has changed to allow for better navigation, both of their own and other's workflows. Users can now create folders in which to organize their workflows, choosing to group them by analysis methods, course or data type, for example.
Also new to the main workflows page is an Advanced Search toolbox. The list of workflows can be filtered by owner, component, date range and access level for the data included in the workflow. The component search covers not only the component names and type (e.g., Analysis, Transform) but also workflow description, results and folders. Four new visualization components have been added: Scatter Plot, Bar Chart, Line Graph and Histogram. Each requires a tab-delimited file as input. The file must have column headers, but can contain numeric, date, or categorical data. In the example below, a DataShop student-step export is used with the Scatter Plot component to visualize the number of times a student has seen a problem vs. the amount of time it took to complete a step.
These visualization components produce dynamic content, allowing users to change both the variables that are being visualized in the output, as well as the look-and-feel of the graph, without having to re-run the entire workflow. The visualization can be downloaded as a PNG image file.
Component developers may wish to have options that contain sensitive data, e.g., login information or keys. Examples of this are the ImportXAPI and Anonymize components. For instance, in the figure below you can see that the ImportXAPI component requires a URL for the data as well as the user id and password required to access the data. With support for private options, the component author can ensure that sensitive fields such as these are visible only to the workflow owner, while other options default to 'public' and are visible to all users.
With this release you can use Web Services to programmatically retrieve LearnSphere data, including lists of workflows, as well as attributes and results for specific workflows. In the next release this functionality will be extended to allow users to create, modify and run workflows programmatically as well. Creating a workflow from a DataShop dataset will establish a relationship between the dataset and workflow. However users may wish to link multiple datasets to a workflow and they may want to do this only after creating the workflow. There is a new "Link" icon on each workflow page that opens a dialog listing datasets that can be referenced; this is available to the workflow owner. Users viewing the workflow can click on the "datasets" link below the workflow name to see which datasets have been linked to the workflow. To facilitate easy sharing of workflows, each workflow now has unique URL. The URL can also be bookmarked. Friday, 13 July 2018
LearnSphere 2.0 and DataShop 10.2 released!This release features more improvements to Tigris, an online workflow authoring tool which is part of LearnSphere. These improvements make it possible for users to better contribute data, analytics and explanations of their workflows.
The Tigris components, still in the left-hand pane, are now displayed in a tree structure. The categories and the organization of the components is the same, and in addition, each category has a "Recently Used" folder. This makes it easier to find the components you most frequently use. We've also added the ability to search for components. The list will update to only show components relevant to the search term. Users can search components by name or any relevant information, e.g., the component author or the input file type.
We consolidated Import functionality into a single component. Now, choosing a data file is simpler because the file type hierarchy is built into the import process. In the new Import options panel, you'll be prompted to specify your file type, which will then filter the list of available, relevant DataShop files. Alternatively, you can upload your own data file in the other tab, as shown below.
Component input nodes are no longer restricted to a single file. This means that components which analyze data across files are no longer limited by their number of input nodes. For example, the OutputComparator component, which allows for visual side-by-side comparison of variables across tab-delimited, XML or Property files, now supports an unlimited number of input files.
The Learning Curve component now allows users to plot multiple predicted error rate curves on a single graph. In the first example we show the predicted error rates for four different KC models, generated using the Analysis AFM component. Because this component allows for multiple input files, we can also use this component to show the predicted error rate curves across different analyses, in this case, AFM and BKT (shown in the second figure).
The DataStage Aggregator component aggregates student transaction data from DataStage, the Stanford dataset repository from online courses.
* These components are available at LearnSphere@Memphis. Monday, 9 July 2018
Attention! DataShop downtime for release of v10.2DataShop is going to be down for 2-4 hours beginning at 8:00am EST on Friday, July 13, 2018 while our servers \ are being updated with the new release. Friday, 23 March 2018
LearnSphere 1.9 and DataShop 10.1 released!This release features improvements to Tigris, an online workflow authoring tool which is part of LearnSphere. These improvements make it possible for users to better contribute data, analytics and explanations of their workflows.
We invite users to contribute their analysis tools and have written a script that can be used to create workflow components. The script can be found in our GitHub repository, along with the source code for all existing components. The component documentation includes a section about running the script. In addition, other changes make it easier to author new components: there is built-in support for processing zip files, component name and type restrictions have been relaxed, and arguments can easily be passed to custom scripts. More information about the detectors available for use in the Apply Detector component, and papers that have been published about them, can be found here. The detectors can be used to compute particular student model variables. They are computational processes -- oftentimes machine-learned -- that track psychological and behavioral states of learners based on the transaction stream with the ITS. The Output Comparator provides a visual comparison of up to four input files. Supported input formats are: XML, tab-delimited and (key, value)-pair properties files. The output is a tabular display allowing for a side-by-side comparison of specified variables. The Text Converter is used to convert XML files to a tab-delimited format, a common format for many of the analysis components in Tigris. The Row Remover allows researchers to transform a tab-delimited data source to meet certain criteria for a dataset. For example, the user can configure the component to remove rows for which values in a particular column are NULL or fall outside the acceptable range.
Saturday, 16 March 2018
Attention! DataShop downtime for release of v10.1DataShop is going to be down for 2-4 hours beginning at 8:00am EST on Friday, March 23, 2018 while our servers are being updated with the new release. |
||||
|
||||